PET Imaging General Topics
Physical
Principles of PET imaging
Agents used in PET imaging are
typically produced in a cyclotron by bombarding a stable element
with protons, deuterons, or helium nuclei. The resulting isotope
will contain excess protons and will decay by positron emission.
PET imaging then utilizes physiologic substrates labeled with
these positron emitting isotopes. The emitted positron travels
only a minimal distance (about 2 mm maximum distance for 18F)
before it undergoes an annihilation reaction with the production
of two 511 keV photons which travel
in a 180 degree direction of one another.
PET resolution is inherently limited
by several factors- the distance the positron travels from the
emitted nucleus to the point of annihilation, the residual
kinetic energy at the time of pair annihilation, random counts,
and the thickness of the detectors [40,92]. The positron emitted
by the radioactive isotope has a certain amount of energy and
will travel a short distance within tissue prior to annihilation
(positron range) [40,92]. This change in
position between the origin of the positron and its site of
annihilation results in positron range blurring, limiting the
spatial resolution of PET imaging [31]. The maximal
range a positron can travel in soft tissue is between 2 to 20
mm, however, only a small fraction have high enough energy to
travel the maximal distance [40]. For 18F (maximum
positron energy 0.64 MeV) the
positron range causes a resolution limit of about 0.22 - 0.6 mm
creating an imaging blurring of less than 1 mm [40,92]. For the worst case scenario of 82Rb
(maximum
positron
energy of 3.35 mEV) the positron
range leads to a resolution limit of 2.6-4 mm [40,92].
Resolution is also limited by the fact that the angular range of
the two annihilation photons is not quite 180 degrees [31]- this
is because of residual kinectic energy (an energetic positron
will transfer more than 511keV) [92]. Depending on the residual
momentum, the spread is actually a Gaussian distribution about
180 degrees with a Full-Width Half-Maximum (FWHM) of 0.3 to 0.5
degrees (which translates to a resolution effect of
approximately 3-5mm for the 100 cm detector separation of a
typical whole-body scanner) [31,40,92,107]. Resolution and
quantitative performance are also affected by the distance
between detectors (detector ring diameter). The closer the
detectors are to each other and to the source, the greater the
resolution.
Unfortunately, the smaller the diameter of the scanner ring, the more likely scattered and random coincidences will be recorded. The primary limiting factor that determines the spatial resolution of a PET scanner is the size of the scintillation crystal (ie: the number of crystals used in the scanner) -- the smaller the crystal, the greater the number of detectors, and the better the spatial resolution [18].
The detectors themselves have an intrinsic spatial resolution
which is quantified by the apparent width obtained for a
collimated point source- the shape of the apparent width is called
the point-spread function and it is often characterized by it's full width at half maximum (FWHM)
[40].
QC of PET and PET/CT
There are four major QC steps that are necessary to maintain a PET system:
(1) Daily blank scan: This is the equivalent of the uniformity
scan for SPECT and is used for testing uniformity of the system
and for normalizing attenuation maps from line source, "dedicated
PET", systems [96].
(2) Normalization: This is used to correct the inherent
differences in sensitivities of the slices, in particular, the
edges of the FOV are less sensitive than at the center [96].
Artifacts from a poor normalization can be recognized as
horizontal linear streaks in the images [96].
(3) Bucket setup or tube balancing: The sensitivity of each tube
can be influenced by temperature, the time the system has been on,
and if there has either been a power surge or sudden power loss
[96]. The daily blank scan must be inspected each day to identify
if the tubes need re-balancing and a bucket setup shoulod be run
by service regularly [96]. A bucket problem can be identified as a
dark "block" rotating on the sinogram data [96].
(4) Line source activity (dedicated PET system only): For systems
employing line source attenuation, it is important that line
sources have adequate activity [96]. If the source strength drops
below a threshold, the system will not be able to reconstruct the
transmission map [96]. Users should regularly inspect the quality
of the transmission data and replace rods according to
manufacturer recommendations [96].
PET cameras-
Detectors/Crystals
All PET scanners use scintillation
technology in which an incident photon interacts with the
detector producing a flash of light that is detected by a
position sensitive photomultiplier tube behind the crystal. The
elements in the detector array are completely or partially
optically isolated from each other using a reflector [91].
Dedicated full ring PET scanners contain thousands of detectors
which permit very good spatial localization, but the systems
resolution is limited by the size of the detector crystal. For
current whole body PET systems using a 70-80 cm detector ring it
is futile to use smaller than 4mm-width crystal elements as the
photon flux per detection element would be too low [91].
However, with miniscule detection elements and high photon
sensitivity, in principle PET is capable of achieving
submillimeter resolution [91]. The only way for clinical PET to
use smaller elements and improve resolution is to improve photon
sensitivity [91]. This can be accomplished by bringing detectors
closer to the patient (as for organ specific cameras) or by
increasing the axial extent of the system [91]. A drawback or
moving the detectors closer to the patient is that more photons
are incident with the detector at oblique angles with respect to
the detectors surface [91]. In this situation, the first
detection element traversed by the 511 keV photon is often not
the one with which the photon has an interaction that results in
a misidentification of the line of response (with resultant
degradation of spatial resolution) [91]. Use of a 3D positioning
detector would enable detection of the actual depth of the
photons interaction and enable correct line of response
determination [91].
The ideal PET detector would have a
very high sensitivity for stopping the incident photon. It would
produce a short and very intense light flash (photofluoresence) that would permit
accurate energy measurement and limit detector dead time. The
timing resolution of the detector crystal is important in 3
ways- reduction of random events by using a tighter timing
window, the ability of time of flight image reconstruction
algorithms if the timing is fast enough (less than 600 ps), and reduction of system dead time
(which allows higher count rates) [88]. The types of crystals
most commonly used in PET cameras include bismuth germinate
oxide (BGO), lutetium oxyorthosilicate
(LSO), gadolinium orthosilicate
(GSO), and thallium-doped sodium
iodide - NaI (Tl).
The physical properties of the crystal will ultimately affect
the performance of the PET camera.
Bismuth germinate
oxide (BGO) crystals are generally used in conventional PET
imaging systems. BGO crystals have a high stopping power (high
efficiency), high spatial resolution, and are 50% more efficient
than thallium-doped sodium iodide -- NaI
(Tl) -- crystals. Most crystals are
3-6 mm thick and they are not hydrophilic. The detection
efficiency for 25 mm BGO crystal is approximately 80% [31]. The
spatial resolution approaches 5 mm, which nears the theoretical
limit of resolution. The disadvantages of BGO crystals are that
they have a much lower light output (15% of NaI (Tl)
crystals), long photofluorescent
decay times (decay constant of 300 ns which limits count
rates/coincidence timing resolution [31]), and poorer energy
resolution than sodium-iodide crystals. Energy resolution of BGO
is normally worse than 20-25% in FWHM at 511 keV. A typical energy window for a BGO
scanner is 300-350 keV to 650 keV [18]. This poor energy resolution
makes it difficult to remove scattered events by energy
discrimination. Therefore, lead-tungsten septa are interposed
between detector rings to reduce interplane
scatter [18]. The coincidence time window is normally set for
10-20 ns. The inferior time resolution causes larger accidental
detections and greater dead times. BGO detectors are best suited
for imaging isotopes with long half-lives such as F-18 and C-11.
Lutetium Oxyorthosilicate (LSO)
crystals offer the best combination of properties for PET imaging [2]. LSO has a higher effective Z
(number of protons per atom) and density compared to BGO which
results in an equal or higher detection efficiency [3,31]. It has very good energy resolution
(about 12% [21]- with a typical
energy window set to 425-650 keV),
a short decay constant for good coincidence timing (a decay
constant of 40 ns and coincidence time window of 4.5 ns), and
higher light output (five fold more
light compared to BGO crystals [31]) [2]. The coincidence time
window is set to 4.5 ns. These characteristics enable image
formation is less time when LSO crystals are used [31]. The
crystal is rugged and nonhygroscopic.
|
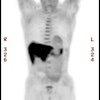
BGO versus LSO detector: The images below were acquired in 2D mode with a scan time of 5 min/bed emission and 3 min/bed transmission. The upper row of images were acquired on a BGO camera system and the lower row of images were acquired on a ECAT Accel LSO PET camera system. The data was reconstructed using normalized attenuation weighted OS-EM reconstruction. Image courtesy of Northern California PET Imaging Center, Sactamento, CA and CTI, The Power Behind PET. |
|
|

Gadolinium oxyorthosilicate (GSO) systems have a lower effective atomic number compared to BGO and LSO crystals- this permits gamma ray detection across a wide energy spectrum (from 28-35keV up to 511 keV) [31]. GSO also has improved energy resolution (10-15%) compared to BGO cameras which leads to a more narrow energy window and better scatter rejection [18,21]. They also operate with a narrow coincidence window of about 8 ns [18]. The decay constant is about 50-60 ns which compares favorably to LSO [21,31]. The light output from GSO is relatively low compared to LSO crystals [21], but is slightly more than BGO [31].
Lutetium yttrium orthosilicate (LYSO) system [63]: LYSO has an effective atomic number of 65; the density is 7.1 g/cm2, and the attenuation coefficient is 0.83 cm-1 at 511 keV [63]. The use of a fast, dense, and high light output scintillator such as LYSO leads to high sensitivity, reduced scanner dead time, and good spatial resolution [69]. The scintillation decay time is 42 ns and it has a light yield that is higher than BGO and similar to that of LSO [63]. The fast decay time leads to improved timing resolution and a narrower coincidence timing window- this in turn reduces the number of random events [63]. The higher light yield permits the use of smaller crystals within a block detector which results in improved spatial resolution (about 4.8 mm near the scanner center [69]) and good energy discrimination (allowing the energy discrimination window to be narrowed by raising the lower discriminator- typical energy range 440-665keV [69])- this has the effect of reducing the scatter fraction [63,69]. Small and average sized patients can be imaged using 1-2 minutes per bed position and 3 minutes for heavier patients with increased attenuation [69].
NaI (Tl) PET
scanners (such as the CPET) utilize curved detectors that
improve spatial resolution. Although NaI
(Tl) detectors have a relatively low
stopping power compared to other PET detectors, they demonstrate
very good energy resolution (11%) and have an excellent light
yield [4]. This permits raising the lower energy threshold to
435 keV (rather than 350 keV which is used in most conventional
BGO PET scanners) to limit scattered events without reducing
true events [4]. The upper energy window is typically set to
590-665 keV [18]. The coincidence
time window is generally 8 ns which is also shorter than that
for BGO systems [4]. A shorter coincidence time window should
improve counting characteristics [4]. The system has a long
crystal decay time (230 ns) compared to LSO systems (40 ns), but
this is shorter than the decay time for BGO (300 ns) [4]. NaI (Tl)
systems rely on a 3-D acquisition mode in order to achieve a
high count density.
LaBr3 is a detector material that is being developed
that can be used for time of flight imaging [40,86].
The
material
has
high
light
output,
a short decay time, and excellent energy resolution that permits
effective scatter rejection (energy gate as high as 470 keV) [40]. The timing resolution is
between 250-275 ps [40]. The stopping
power is somewhat lower than LSO.
Semiconductor crystals composed of cadmium zinc telluride (CZT)
are a potential means to further improve the spatial resolution of
PET cameras [91]. Their one drawback is relatively poor time
resolution (that can result in higher random coincidence
detections), however, the excellent energy resolution, tight
energy windowing, and the ability to estimate the direction of
incoming photons can help to mitigate this potential problem [91].
Digital silicon photomultipliers have improved spatial and timing
resolution resulting in better image quality, improved lesions
detection (particularly for small lesions), decreased lesion MTV
(due to decreased partial volume effect), and higher SUVs [113].
Time of Flight (TOF) PET imaging systems previously utilized cerium fluoride (CeF3) or barium fluoride (BaF2) crystals. These crystals had very short resolving times and coincidence localization could be obtained to within a fraction of a nanosecond, permitting improved sensitivity and signal to noise ratio. The coincidence time window was normally set for 2 ns or less. Unfortunately, these crystals had poor energy resolution and less light output than BGO crystals. The use of deeper detectors also degraded image resolution. Presently, LSO cameras can also be used for TOF limaging [86].
When an annihilation event occurs
away from the midpoint of the line-of-response (LOR), one photon
travels a shorter distance than the other and reaches the
corresponding detector earlier [83]. TOF PET uses very fast
detectors to improve localization of events along coincidence
lines-of-response (i.e.- determine
the difference in arrival times between the two photons to
estimate the actual point at which the annihilation occurred
along the LOR) [83,104]. With LSO-based scanners, the time
difference between the arrival times can be measured to be
better than 600 ps- which corresponds to a spatial uncertainty of
less than 9cm [86]. Although this is insufficient to place an annihilation within a single voxel, the level of uncertainty is
better than having no localization information and assigning
equal probability to all voxels
along the line of response [86]. The main advantage of TOF-PET
is to improve statistical data by reducing noise (improving
signal-to-noise ratio), not spatial resolution [83,100]. For a
40-cm diameter uniform distribution of radioactivity and a
timing resolution of 600 ps, TOF
imaging should improve the signal to noise ratio by a factor of
2:1 [86]. TOF-PET is best for imaging large objects with low
contrast (due to the presence of less background noise) and for
studying dynamic processes. One advantage of TOF PET is that it
can improve image quality in heavy patients [78,86]. In one study, TOF PET resulted in
improved lesion detection- particularly for low contrast lesions
and the improvement was most pronounced in heavier patients [89].
SUV measurements obtained from TOF images are higher than those
obtained on standard PET imaging [101].
Point spread modelling reconstruction [112]:
PET imaging is subject to partial volume effect, or image
blurring, and spillover of signal between adjacent fucntional
regions [112]. Point spread function (PSF) modelling is a partial
volume correction method that can be used to image quality [112].
In the PET scanner, a photon coming from the center of the FOV is
more likely to have a correctly localized line of response [112].
However, with increasing distance of the photon from the center of
the FOV, it is more likely that the line of response is
incorrectly localized because of the photon striking the crystal
at an angle and continuing to travel to another crystal [112].
This leads to distortion of the deges of the FOV [112]. PSF
modeling compensates for this distortion because measured PSFs at
several million points in the FOV are incorporated into the
estimation step of the PET reconstruction algorithm, thereby
reducing partial volume effects, improving spatial resolution, and
increasing SUV measurements [112].
System
dead time:
When a photon interacts with a
detector the crystal produces a light flash which is collected
by several photomultiplier tubes (PMT's). The photomultipliers
tubes determine the energy and
spatial position of the event and this is followed by
coincidence processing [18]. The total time required to complete
these tasks is the system dead time. During this time, the
system is unable to collect new incoming events which will be
lost [18]. System dead time can be reduced when using scanners
with shorter crystal scintillation times (such as LSO cameras)
or by using a greater number of PMT's [18].
Image Acquistion: 2D versus 3D
Compton scatter occurs when a photon undergoes an interaction which results in a lower energy and a new trajectory [18]. Scatter removal is important because scatter will create image blurring [18]. The most ideal way to remove scatter would be to detect only 511 keV events- however, this requires systems with very good energy resolution and a narrow photo-peak window [18]. Unfortunately, this is not practical as most BGO PET systems have limited energy resolution and require wide energy windows (i.e.: scatter cannot be completely rejected by energy discrimination alone [55]) [18].
PET images can be acquired in either a 2-D or 3-D mode. To reduce the number of scattered photons in 2-D acquisitions, lead or tungsten septa are placed between the detectors to absorb scattered radiation (out of slice activity) [55]. The septa reduce the amount of scatter to 10-15% of the total counts acquired [3] and improve image contrast. However, the septa also reduce the sensitivity for unscattered photons [55] and random coincidence events (and some scattered events) will still be recorded and provide incorrect localization information which degrades the image. The number of random events generally increases with the dose of administered activity. A general rule of thumb for PET imaging using a BGO camera is that if there are sufficient counts to perform a study in 2-D mode, then that is the preferred scanning method. For BGO scanners, 2D acquisitions using the maximum allowable injected dose produce images with superior lesion detectability [34].
|
Random events: A random coincidence event occurs when photons from two separate annihilation reactions are detected within the timing window. The event will be localized along a path that does not correspond to the origin of the photons. |
|
|

When the septa are removed this is referred to as a 3-D acquisition and there is a large increase in the sensitivity of the detector [18]. In this type of acquisition, each individual detector is sensitive to radiation from a much larger area and the count-rate increases 5-6 fold compared to a 2D acquisition [3,18]. 3-D imaging can significantly reduce the amount of tracer activity needed for the exam or shorten the acquisition time [5]. 3-D scanning requires faster coincidence detection, more computer memory, and more time for image reconstruction [5,18]. Lutetium oxyorthosilicate (LSO), gadolinium oxyorthosiliacate (GSO), and NaI (Tl) PET scanners have physical properties which permit them to perform better than BGO cameras for 3-D image acquisitions [40,55]. In fact, when using an LSO camera, two-minute/bed 3-D position emission scans have been shown to detect all lesions seen on 4-min/bed position images, although exam quality will improve with longer acquisition times [35]. Because photon attenuation and scatter is higher in obese patients there is loss of true coincidences which degrades the signal-to-noise ratio [43,53]. This can particularly affect 3D acquisitions- a five minute per bed position scan appears to be adequate to detect lesions when using LSO imaging in obese patients (and a dose of 0.21 mCi 18F-FDG/kg) [43]. [55]
3-D scanning is often used for CNS imaging (even with a BGO scanner) because it is a small object containing a large amount of activity. Pediatric patients are also sometimes imaged with a 3D acquisition.
Disadvantages of 3-D scanning are:
1- The count rate limit of the scanner can be overwhelmed if too much activity is administered. With high count rates pulses can "pile-up" and the detector may become paralyzed due to dead time [40].
2- Increased random events: A random event occurs when photons from two separate annihilation events are detected within the preset coincidence time window and are recorded as a coincidence event- this produces low-level noise in the PET image [18]. The random coincidence rate increases with the amount of activity in the patient [40]. In 3-D mode, an increased number of random events will be detected and degrade the image. For a given total counting rate, the fraction of random events recorded will be greater when scanning in 3-D mode [1]. When scanning in a high counting rate environment, the random counting rate increases much more rapidly than does the true counting rate as a function of radioactivity in and near the field of view [1]. The true counting rate scales linearly with radioactivity in the field of view, while the random rate scales as the square of the radioactivity in and near the field of view [1]. The most common method of correcting for random coincidences is a real-time subtraction of a delayed coincidence channel, where one of the single-photon events has an arbitrary large time delay [45]. The rationale for this method is that a delayed coincident event cannot arise from a true or scattered coincidence event [45]. However, other methods of correction such as a reduced variance random estimation may result in an improved SNR [45].
3- Increased scatter: Scatter occurs when one (or both) annihilation photons are deflected (via a Compton interaction) within the body prior to detection- this results in an incorrect localization of the event and degrades the image [1]. In 3-D mode, the number of scattered events approaches 30% to 50% of all recorded events [51]. Because of this, for proper quantification, a scatter correction must be applied to 3-D data.
4- Increased number of bed positions: In 3D mode, the increase in system sensitivity that results from all events in the field of view (FOV) being seen by the scanner produces a sensitivity profile with a maximum in the center of the FOV. There is a rapid decrease in the profile on moving away from the peak [18]. For this reason, whole-body exams need to reduce the axial FOV to maintain a uniform count profile. This results in an increase in the number of bed positions to cover the same patient length [18].
Attenuation
Correction
PET technology allows for attenuation correction of the images. This can produce a more accurate final image that may detect smaller lesions, especially when they are deep within the body [11]. The disadvantages of attenuation correction is that it requires more time for image acquisition and there is the potential to add noise to the image if the attenuation measurements become misaligned by patient motion [11].
Attenuation correction is performed to account for internal absorption of photons. Previously, on older generation PET scanners, attenuation correction of emission images was performed by obtaining a transmission scan utilizing a 511 keV source (such as 68Ge) or 137Cs (662 keV). The typical patient dose from a transmission scan using a 68Ge source was about 0.08-0.13 mSv [51]. With the advent of PET/CT, x-ray transmission images from a CT scan are now used for attenuation correction. The use of CT for attenuation correction reduces whole body scan times by at least 40% [79]. However, it should be remembered that the use of CT for attenuation correction does result in additional patient radiation exposure [25].
Transmission scans using a radionuclide source use the PET detectors for data collection and are acquired over many breathing cycles (standard transmission scans require 18 to 35 minutes to complete) [7,16,41]. Standard transmission scans contain high levels of noise and have low resolution compared to CT images [41]. The quality of attenuation corrected images will be degraded by patient motion between the emission and transmission acquisitions. Motion will create image artifacts- either photopenic defects or apparent lesions. Artificial lesions created by motion between the two data sets will not be present on non-attenuated corrected images.
|
Attenuation correction: The images below are from the same patient. The image on the left is non-attenuation corrected (the lungs and skin surface appear warm). The right image is corrected for attenuation. Note the improved visualization of structures deep within the body. |
|
|

CT scanners are now incorporated into PET scanners for the purpose of co-registration imaging and attenuation correction- see discussion below.
PET/CTand
Co-registration Imaging:
Co-registration of the PET and CT data is a benefit of combined PET/CT units. Combined PET-CT images are more effective than PET images alone in precisely localizing neoplastic lesions and in distinguishing normal uptake from juxtaposed neoplastic lesions [20,23,32,47,74]. PET-CT fusion data can lead to a significant change in impression in 20% of oncologic cases [15]. Even in cases where no change in impression occurred, there is greater diagnostic confidence [15], improved diagnostic accuracy [47], and fewer equivocal lesions [32]. PET-CT may affect patient treatment significantly and improve specificity more than sensitivity (through better identification of benign abnormalities [most commonly inflammatory] with increased FDG accumulation) [15,74]. The results of PET/CT exams can impact on patient management in 14-18% of patients [20,32]. Settings in which PET/CT imaging is particularly useful include radiation therapy planning, preoperative surgery/biopsy planning, in the evaluation of head and neck tumors, and in the detection of recurrent abdominal and pelvic malignancies [39,47].
The CT examination can also be used for attenuation correction. The advantages of using CT is that the transmission scan be be acquired in under one minute (thereby shortening the overall PET exam time by 25-30% when compared to a standard PET imaging [56]), the images have higher spatial resolution, and there is significantly improved lesion classification because of the ability to co-register the PET and CT data sets [7,10]. An additional benefit is that by eliminating the radionuclide source for transmission scanning, CT units remove the need for periodic replacement of decayed transmission sources [7].
The CT examination can be a diagnostic examination if the patient has no prior imaging studies, or a low dose exam performed for attenuation and localization purposes. In general, for a localizer exam a 40-80 mA tube current and 120-140 kVp x-ray energy is used [28,48]. The tube current can be adjusted down to 40 or 60 mA in very small patients, or up to 120-160 mA in larger patients [28]. Before the exam, patients should remove all metal that could lead to streak artifacts on the CT transmission scan [26]. Having the patient's arms by their sides also produces beam hardening artifact and therefore, whenever possible, the patients arms should be immobilized above their head [28]. For head and neck cancer patients, a second PET/CT acquisition can be performed with the arms down to better image the neck region [68]. Imaging though the chest is optimally performed during a normal expiration breath hold [28]. Although other authors have found very good registration between PET and CT data sets when the CT was performed at mid breath-hold [85]. If the patient cannot maintain an expiration breath hold for the CT exam, then the study should be performed with the patient breathing quietly [28].
For a high-quality PET/CT examination (PET and diagnostic CT exam) patient radiation exposure is increased compared to a standard PET examination (about 25 mSv [2.5 rad] for the combined PET/CT exam compared to about 5.7 to 7 mSv [0.57 to 0.7 rad]) [44,66,76]. This is roughly equivalent to 125 chest radiographs (at an average of 0.2 mSv per radiograph) and is equivalent to 7 years of background radiation exposure [76]. The radiation dose to the patient can be lowered if the CT examination is performed using a low dose technique (which would decrease the effective dose from the CT portion of the examination to less than 5 mSv (0.5 rad)) [44]. However, even at low tube currents the radiation exposure from CT can be 1 to 2 orders of magnitude larger than the small dose from a 68Ge source (tens of millirads at most) [71]. For perspective- background radiation exposure in the United States is about 360 mrem (3.6 mSv) per year [66]. The estimated dose for a round-trip transatlantic flight between New York and Paris is about 12 mrems (0.12 mSv) [66].
|
PET/CT exam: The images below are from a PET/CT exam. The patient moved between the acquisition of the CT study and the PET exam- hence- there is misalignment of the two exams. |
|
|

The scaled CT images are also interpolated from the CT to the PET spatial resolution- therefore, the high resolution of the CT images is degraded for generation of the attenuation factors [70,79]. When using CT for attenuation correction- attenuation values are energy dependent [24]. Attenuation maps are displayed in HU's and the measured coefficients at the original acquisition energy are scaled on a pixel-by-pixel basis to 511 keV [24]. Materials with high Zeff values may exceed the dynamic range of attenuation values measurable by the CT scanner creating artifacts [79]. True FDG activity may be overestimated with CT based attenuation correction with an average overestimation of 11% in bone and 2.1% in soft tissue [75]. Calculated SUV's may be slightly higher when using CT attenuation correction and caution should be exercised if comparing data between CT and separate transmission scans [7].
Most PET/CT scans are acquired using a combined PET/CT unit. However, software fusion can be applied to PET and CT data sets acquired on separate units. Studies have shown that thoracic alignment does no significantly differ between PET/CT or from separate PET and CT exams obtained on the same day when carefully matched for anatomic positioning and respiration [54]. If the PET and CT exams are acquired on separate units, the use of a vacuum cushion aids in reproducible patient positioning which improves fusion [46].
Although the CT exam used for attenuation correction is generally not a diagnostic quality study, the CT examination can reveal clinically important findings that are not FDG avid [61]. Major non-FDG avid clinical findings have been described in up to 4% of patients and these findings can affect clinical management [61]. Therefore, review of the CT examination is important and should be included in the final report [61]. Missed findings on the CT scan can be related to expiratory imaging of the lungs (or respiratory motion), lack of IV contrast, beam hardening artifacts if the patient has their arms by their sides, lack of oral contrast, and low mA resulting in image noise [73]. Small lung nodules are commonly not identified on expiratory or motion degraded images. However, small nodules (less than 1cm) can be identified on the CT images and lung windows should always be reviewed. In patients with a known oncologic history, lack of FDG accumulation in these small nodules does not exclude malignancy [64]. Almost 20% of such nodules will subsequently prove to be malignant and the risk is increased if there is more than one nodule [64]. [73].
Image
artifacts on PET/CT exams:
1- Respiratory motion:
Respiration during image acquisition was not a significant problem with older PET scanners that acquired 68Ge emission scans for attenuation correction. Both the emission and transmission data sets were equally blurred by this motion [71]. One problem with CT attenuation correction is that the emission PET exam is acquired over several minutes while the CT exam is acquired in a single breath hold. Co-registration of the PET and CT data sets is not always perfect due to respiratory motion- this problem is most significant in the lung bases, lung periphery, and liver dome [3,10,12,13]. A curvilinear cold artifact paralleling the dome of the diaphragm at the lung bases is a frequently noted artifact on PET/CT image acquisitions obtained at free tidal breathing (it can be seen in up to 84% of cases [39]) [13,50]. The artifact is usually mild, but can be significant if the CT exam is acquired with deep inspiration [16]. The artifact is due to an inaccurate correction for photon attenuation at the lung base because of inconsistencies in the liver-lung interface between the PET and CT acquisitions [13]. This artifact can also result in a significant decrease in measured SUV within a pulmonary lesion in the lung base [16,50]. A mismatch between the data sets can also lead to the erroneous placement of a lung lesion into adjacent structures such as the liver or a rib [12]. Liver lesions may be incorrectly localized to the lung bases [13]. Shallow breathing during the CT exam can help to decrease the artifact and improve fusion of the data sets [62], however, CT images acquired with shallow respiration have been shown to result in the failure to identify small lung nodules compared to breath hold imaging [58]. The artifact is best minimized when the CT examination is acquired with a normal expiration breath hold protocol [16]. CT images acquired during normal expiration rather than with shallow respiration demonstrate improved co-registration of pulmonary nodules with PET images [12]. Alternatively, respiration-averaged CT has also been shown to reduce misalignment between the CT and PET data sets [50]. All of these techniques will likely result in the inability to confidently identify all small lung nodules and the chest CT portion of the exam should be regarded as not of diagnostic quality if not performed with breath hold at end-inspiration [58,62]. Some centers will perform an additional low dose CT scan of the chest during maximal inspiration for better identification of lung nodules [67]. See also discussion: SUV measurement and respiratory motion
Significant registration errors can also involve the liver due to respiration- particularly the diaphragmatic area [72]. [86]
2- Other reconstruction artifacts:
Reconstruction artifacts can also occur in the pelvis due to displacement of organs and bowel by bladder or rectal filling [25,30]. This problem is best solved by keeping the interval between the CT scan and the PET scan as short as possible [25] and by beginning the PET scan over the pelvis and proximal thighs [68].
Another artifact is related to truncation which occurs due to a discrepancy in the size of the field of view (FOV) for the CT scanner versus the PET scanner [60]. When large patients undergo CT imaging portions of their body may lie outside the FOV resulting in truncation artifact which appears as poorly defined areas of high density along the margins of the patient [60]. Because the PET scanner has a larger field of view- the entire patient is imaged. The discrepancy between the field of views causes some sections of the PET emission data not to have any corresponding attenuation correction factors [60]. The net effect is an overestimation of the activity corresponding to the image rim (the ill-defined area of high density at the margin of the CT scan) and an underestimation in the region without correction factors (the portion of the patient that was not included on the CT image) [60]. SUV measurements in these areas will be incorrect [60].
3- Effects of contrast and high attenuation/metallic objects:
Oral and IV contrast, as well as pacemakers and metallic implants can result in image artifacts. CT based attenuation correction is subject to error because it requires conversion of the x-ray attenuation factors obtained at CT (120-140 kVp) to attenuation at PET energy (511 keV) [68]. On previous attenuation correction algorithms, contrast would be misclassified as high-density bone and the 511-keV-equivalent attenuation coefficient values for the contrast are over-estimated resulting in over-correction for attenuation in PET images [22]. This produces an apparent increased concentration of radiotracer in the contrast region on the attenuated corrected images [22]. Newer attenuation correction algorithms have reduced or eliminated the problem of artifactually increased activity in regions of high contrast enhancement [68].
IV contrast and PET/CT imaging: IV contrast enhanced CT exams may result in PET image artifacts if used for attenuation correction [8,19]. The artifact appears to be related to the transient bolus of undiluted contrast within the large veins of the chest and often produces a focal area of increased activity on attenuation corrected PET images (i.e.: an overestimation of FDG activity) [8,19,27]. This is because the contrast agent results in greater attenuation of CT photons, compared to the 511keV PET photons which results in an overestimation of PET activity on reconstructed images [19,27]. The effect is most pronounced at the location of the CT contrast agent, but does also affect other regions within the slice [17]. At a contrast concentration of 200 HU, the percent overestimation of FDG activity was between 10% to 15%, but it can be as high as 45% at an HU of 1,360 [19]. Organs that demonstrate strong contrast enhancement, such as the kidneys and liver, can also be affected [19]. Generally, the SUV is elevated between 5% to 7% [36], however, overestimation of activity can be as high as 25% in the kidneys, and between 12-15% in the liver [19]. In patients with liver tumors, it is possible that over-estimation of background hepatic activity could result in obscuration of subtle hepatic lesions [19,36]. Although a similar effect is seen in the kidneys, the generally high concentration of activity in the kidney, ureters, and urinary bladder make evaluation of these structures more difficult anyway [19]. The effects of contrast agents could be avoided by performing the fusion/attenuation correction CT exam without contrast, and then performing a contrast enhanced exam after completion of the PET study [19]. Unfortunately, this results in increased patient radiation exposure [19]. Other articles suggest that although there is slight artificial elevation in SUV values following I.V. contrast enhanced PET/CT imaging, it is not clinically significant and does not alter exam interpretation [36,56]. A dual-phase contrast injection (80 and 60 mL at 3 and 1.5 mL/sec respectively) in the craniocaudal direction with a 50 second delay has been proposed as a CT protocol which yields consistent high image quality with few artifacts [37]. Alternatively, caudocranial scanning or using a saline chaser immediately after contrast injection can also aid in avoiding contrast associated artifacts [67].
Oral contrast and PET/CT Imaging: High density barium will attenuate more CT x-rays with energies of 70-140 keV, than 511 keV photons due to the high atomic number of barium which results in an increased fraction of photoelectric interactions- this produces an increase in Hounsfield units on CT images [22]. An over-estimation in PET activity of up to 20% can be seen in regions where barium-based oral contrast is present [65]. When a lesion is present within the contrast volume, this can obscure the lesion [22]. Also- high density oral contrast can produce beam hardening artifacts which can produce apparent areas of increased FDG activity on attenuation corrected images [9,14,22]. Oral contrast with 1.3% barium, as used commonly in CT contrast studies, does not appear to be associated with the creation of attenuation correction artifacts [14]. However, if the concentration of the oral contrast in the lumen increases markedly as a result of significant water resorption, it is possible that artifacts may be produced [14]. Oral contrast may also affect SUV's generated for intralumenal lesions resulting in an over-estimation of the lesion's SUV [22], however, this effect does not appear to be medically significant [17]. Low density neutral oral contrast can also be used to improve visualization of the bowel without producing detectable errors in attenuation correction [84].
A way to avoid contrast-induced artifacts is the use of a water as an oral contrast agent, unfortunately, this may result in increased urinary urgency during the scan [27,30].Another option is to use VoLumen - a low density barium sulfate suspension that acts as a negative oral contrast agent [65,68]. Substances can be added to avoid absorption of the water- for instance, a combination of water, 2.5% mannitol (to increased bowel distention due to osmotic properties), and 0.2% locust beam gum (LBG- to avoid absorption due to a gelling action) [27,30]. Superior bowel distention can be achieved with this preparation because mannitol enhances secretion of water into the bowel, and LBG prevents the intestinal absorption of water [30]. The cost of this preparation is about $3 for one liter (which is close to the price of a 500 ml bottle of barium contrast- about $3.50) [30]. A small number of patients may experience watery diarrhea after the exam from this preparation [30].
Metallic hardware: Metal implants associated with chemotherapy ports, artificial joints, or dental fillings cause beam hardening and scatter artifacts which can produce apparent increased tracer activity on the corrected PET images [26]. Most metals exhibit strong photoelectric absorption of x-rays, but interact with 511 keV gamma rays primarily via Compton scattering [38]. The CT attenuation correction scaling algorithm does not account for this effect and causes overcorrection of the PET images resulting in artifactually increased FDG activity at that site [38]. Overcorrection is not a signifnicant problem with conventional PET scanners that use 68Ge/68Ga or 137Cs transmission sources with gamma energies of 511 keV and 662 keV, respectively [38].
Cardiac pacers and central venous catheter reservoirs can produce a focal area of artifactual increased FDG uptake on CT corrected PET images [29]. For cardiac PET imaging, defibrillator leads can be particularly problematic if they are placed in close relationship to the left ventricle [38]. Falsely elevated FDG uptake of 44-81% be seen at the lead location [38]. This focal area of increased activity can mask a perfusion defect and can also interfere with image normalization [38]. Reservoirs usually produce only a mild focus of increased activity, while pacemakers produce a more moderate focal abnormality [29].
Dental hardware can also produce beam hardening artifacts which can produce apparent areas of increased FDG activity on attenuation corrected images [9,14].
Review of the non-attenuation corrected emission images will NOT demonstrate the increased activity artifacts if they are related to CT beam hardening [9].
4- Body habitus:
For PET/CT, image quality is degraded as body weight increases- this is largely because of the increase in attenuation associated with the higher BMI patients [79,82]. For obese patients, scan quality can be maintained by increasing scan duration (increasing FDG dose does not appear to improve image quality) [82].
PET scanner QC:
PET scanner QC is less
extensive than for gamma cameras [80]. Two routine QC tests are
the blank scan and tomographic
uniformity [80]. Blank scans are performed daily by uniformly
irradiating the detector elements using either the 68Ge
or 137Cs transmission source (for pure PET scanners)
or with a 68Ge cylinder centered in the FOV (for
PET/CT scanners) [80]. The acquired data is displayed as a sinogram [80]. A line or band through
the data set is indicative of a faulty detector element [80].
Tomographic uniformity is evaluated daily or at least weekly using a 18F-filled or 68Ge cylinder [80]. Non-uniformities are common in PET scanners that contain 10,000-20,000 detector elements due to electronic performance and line of response counting rates [80]. Non-uniform response can be corrected by acquiring data for a uniform flux of annihilation gamma-rays (normalization scan) [80]. The PET scanner normalization should be created or updated at installation, after major service, whenever deteriorating image quality suggests it is required, or otherwise at least annually [80].
PET/MRI:
PET/MR systems can acquire PET and MR data simultaneously.
Photomultiplier tubes used in standard PET detectors are sensitive
to magnetic fields which will cause electrons to deviate from
their original trajectory and result in loss of gain [59]. One way
to overcome this problem would be to use optical fibers to carry
the scintillation light outside the fringe of the magnetic field,
but the use of such long fibers will result in light loss leading
to degradation of energy and timing resolution [59]. Avalanche
photodiode detectors (APD) are semiconductor photosensors with
silicon-based photomultipliers that can replace traditional
photomultiplier tubes permitting fusion of PET and MRI data
[59,94,98]. APD's are not affected by strong magnetic fields and
do not show degradation even in magnetic fields up to 9.4T
[59,94]. Shielding of the PET detector components is still
necessary to prevent distortion of the PET signals by MRI
radiofrequency pulses [98]. Interestingly, the distance positrons
travel prior to annihilation, especially for higher field strength
magnets, is reduced in the direction orthogonal to the magnetic
field, leading to in-plane improvement in the resolution
proportional to the field strength [103].
Because of relatively long acquisition times, high-resolution
sequences may be acquired only in selected regions of interest and
in one preferred anatomic orientation (nonisotropic) [94]. MRI is
also less sensitive for the detection of small lung
nodules/metastases compared to CT [95].
Another problem is that PET/MRI suffers from the lack of accurate
MRI-based methods for attenuation correction of the measured PET
emission date [93]. Unlike CT, which measures attenuation of
tissues making attenuation correction straight-forward, the MRI
signal is determined by tissue hydrogen density and relaxation
properties making attenuation correction more complex (ie- the MRI
image does not have a direct relationship to photon attenuation)
[93,98]. The Dixon MRI sequence can be used to allow estimation of
the distribution of 4 different tissue types (fat, soft tissue,
lungs, and background/air) throughout the body and the calculation
of an attenuation map on the basis of the presumed radiodensity of
these tissue types [94]. One major limitation of MR is the
difficulty in accurately identifying bone structures [105]. This
limitation results in inaccuracy in the quantitative measurement
of tracer concentrati (SUV) in organs near dense bones [105].
One study has suggested that PET/MR can provide findings not seen
on PET/CT that affect clinical management in up to almost 18% of
patients [97]. Compared to PET/CT, the unenhanced MR portion of
the PET/MR exam provides superior evaluation of bony and liver
metastases, the kidneys, the breast, cervix, and urinary bladder
[97]. However, one article that compared PET/MR (using a fast MR
protocol) to PET/CT found no improvement on PET/MR in diagnostic
accuracy for the staging of non-small cell lung cancer [109]. The
one limitation of PET/MR is in the detection of small lung nodules
which has been shown to be inferior to PET/CT, especially for
nodules less than 1 cm (of which up to 21% may be
malignant/metastatic [110]) [97,102]. Adding a diagnostic MR
imaging sequence for lung analysis in deep inspiration aids in
nodule detection, but the exam is still inferior to PET/CT [102].
Also- for the evaluation of head and neck cancer, artifacts can
occur in the infrahyoid region mainly related to swallowing or
respiration [99].
Artifacts:
1- Metallic implants
2- Magnetic field artifacts: High magnetic fields will affect the
trajectory of emitted positrons [105]. The magnetic field will
reduce the positron range in the plane perpendicular to the field,
thus improving transaxial resolution [105]. However, the positron
range will be elongated along the direction of the magnetic field
and this can worsen axial resolution and result in shine-through
artifacts [105,106]. Shine-through artifacts occur when lesions
are close to air cavities and appear as an apparent activity
concentration on the reconstruction image on the other side of an
air cavity [106].
Advantages of
PET- Quantification
PET provides quantitative in-vivo measurement of functional processes: perfusion, metabolism, and receptors. PET can localize and measure the distribution of neuroreceptors by detecting sub-nanomolar concentrations of labeled drugs. The spatial resolution of PET is superior to SPECT (5 -8 mm) and it has accurate correction for photon attenuation which is not yet available for SPECT imaging. The high temporal resolution of PET (high count rate) also permits dynamic imaging.
Absolute quantification of data is performed using compartmental kinetic models [42]. The dynamic behavior of each tracer in vivo is assumed to follow a standard three-compartment kinetic model with two tissue compartments (an extravascular pool of tracer in the tissue and a bound or non-displaceable component) and a single arterial input function (arterial concentration of free, unmetabolized tracer) [42]. Unfortunately, obtaining arterial blood samples is difficult [42].
PET agents and their
uses (Table)
|
Agent |
Images |
|
F-18 fluorodeoxyglucose |
Regional glucose
metabolism |
|
F-18-fluorodeoxythymidine |
Tumor cell proliferation |
|
18-F-fluoro-L-tyrosine |
Tumor protein synthesis |
|
18-F-fluoro-DOPA |
Neuroendocrine tumors, CNS tumors, Parkinsons
disease |
|
18-F-fluoromisonidazole |
Tumor hypoxia |
|
F-18 sodium fluoride |
Bone
tumors |
|
C-11
methionine |
Amino acid uptake/protein
synthesis |
|
C-11 choline |
Cell
membrane proliferation |
|
C-11 thymidine |
Tumor
proliferation |
|
C11 verapamil |
Tissue
P-glycoprotein (multidrug resistance) |
|
C-11 deoxyglucose |
Regional brain
metabolism |
|
O-15 oxygen |
Metabolic rate of oxygen
utilization/OEF |
|
C-11 carbon monoxide |
Cerebral blood volume |
|
O-15 carbon monoxide |
Cerebral blood volume |
|
O-15 water |
Cerebral blood
flow |
|
O-15 carbon dioxide
(Inhaled) |
Cerebral blood flow |
|
C-11 butanol |
Cerebral blood flow |
|
C-11 N-methylspiperone |
Dopamine D2 and
Serotonin S2 receptors |
|
F-18 N-methylspiperone |
D2 and S2 receptors |
|
C-11 raclopride |
D2 receptors |
|
F-18 spiperone |
D2 receptors |
|
Br-76 bromospiperone |
D2 receptors |
|
C-11 carfentanil |
Opiate mu receptors |
|
C-11 flumazenil |
Benzodiazepine (GABA)
receptors |
|
62Cu-ATSM |
Tumor hypoxia |
PET Agent Dose
Estimates:
18F-FDG:
18F is produced in a cyclotron through proton bombardment of enriched 18O-water (18O + p → 18F + n) [6,77]. 18F decays to stable 18O by positron emission with a half life of 109.77 minutes. A standard PET emission scan delivers a dose of 5-10 mSv (0.5 to 1 rad) to the body (1 mSv = 0.1 rad) [25,44,81]. A traditional germanium-based transmission scan delivers no significant additional dose to the patient [25]. A high-quality diagnostic PET/CT examination can deliver an effective dose of 23.7 to 26.4 mSv (about 2.5 rad) [44,81]. The CT portion of the exam can contribute between 54-81% of the total combined dose [81]. The radiation dose to the patient can be lowered if the CT examination is performed using a low dose technique (which would decrease the effective dose from the CT examination to less than 5 mSv (0.5 rad) [44]. Using a screening CT protocol, doses between 6.34-9.48 mSv have been reported for PET/CT examinations [81]. The urinary bladder wall receives the largest dose (up to almost 59 mSv [81]), but the dose is variable and affected by bladder volume and frequency of voiding [6]. In infants, the bladder dose is about 4 fold higher than adults and absorbed dose to the brain is about 10-fold higher [125]. Estimated absorbed doses are listed below [6]:
|
Target organ |
Absorbed dose in rad/mCi
(mean +/- SD) |
|
Brain |
0.17 +/- 0.044 |
|
**Heart wall |
0.25 +/- 0.13 |
|
Kidneys |
0.078 +/- 0.022 |
|
Liver |
0.088 +/- 0.031 |
|
Lungs |
0.056 +/- 0.031 |
|
Pancreas |
0.052 +/- 0.006 |
|
Red marrow |
0.040 +/- 0.006 |
|
Spleen |
0.056 +/-0.008 |
|
**Urinary bladder wall |
0.27 +/- 0.16 |
|
Ovaries |
0.041 +/- 0.005 |
|
Testes |
0.041 +/- 0.005 |
|
Whole body |
0.043 +/- 0.002 |
18F-FDG in pregnancy:
Fetal radiation doses are higher in early pregnancy than in late
pregnancy [108]. The radiation dose estimates are 2.2-2.5 x 10⁻²
mGy/MBq in
early pregnancy, 1.3-2.2 x 10⁻² mGy/MBq at 3 months gestation, 1.7 x 10⁻²
mGy/MBq at
6 months gestation, and 1.7 x 10⁻² mGy/MBq at 9
months gestation [33,111]. One study suggested fetal exposures
between 1.1 to 2.43 mGy for various trimesters (although higher in
early pregnancy [9.04 mGy])- however, this study used Ge-68 for
attenuation correction, not CT, and also used lower doses of 18F-FDG
(5-10 mCi) [90]. Other authors feel that besides maternal
activity, FDG crosses the placental barrier and there is tracer
uptake in the fetal tissue [87,90,108] which contributes to the
dose and that the dose to the fetus in early pregnancy can be as
high as 4.0 x 10⁻² mGy/MBq [87]. The relatively higher absorbed
dose found in early pregnancy is likely explained by the smaller
volume of the fetus and by the fact that the fetal body at this
stage is composed of relatively undifferentiated rapidly
proliferating cells which will concentrate more FDG [108]. Early
and frequent bladder voiding can reduce doses by 25-45%
(particularly in early pregnancy), so proper hydration and, unless
contraindicated, the use of a bladder catheter are recommended
[108].
Weeks 3 and 4 of gestation are the most sensitive for the
induction of embryonic death, which might occur after irradiation
with 100 mGy [108]. The period between 4 and 15 weeks is themost
sensitive for irreversible whole-body growth retardation,
microcephaly, and mental retardation which occur at doses higher
than 200 mGy [108]. Regardless of the level of exposure, pregnant
patients in one study all delivered healthy infants following
inutero exposure to 18F-FDG [90]. Also- the fetal dose
is well below the threshold dose for deterministic effects
(100-600 Gy) (there is no threshold for stochastic effects)
[90,111]. Even with the most conservative assumption, a full
PET/CT is unlikely to deliver more than 15-20 mGy to the fetus
(and the dose from PET/MR is more likely 5 mGy or less) [108].
REFERENCES:
(1) J Nucl Med 2001; Votaw JR, White M. Comparison of 2-dimensional and 3-dimensional cardiac 82Rb PET studies. 42: 701-706
(2) J Nucl Med 2000; Melcher CL. Scintillation crystals for PET. 41: 1051-1055
(3) Radiol Clin N Am 2001; Fahey FH. Positron emission tomography instrumentation. 39: 919-929
(4) J Nucl Med 2001; Adam LE, et al. Performance of a whole-body PET scanner using curve-plate NaI(Tl) detectors. 42: 1821-1830
(5) J Nucl Med 2001; Knesaurek K. New developments in PET instrumentation: quo vadis PET. 1831-1832
(6) J Nucl. Med 2002; Hays MT, et al. MIRD Dose Estimate Report No. 19: Radiation Absorbed Dose Estimates from 18F-FDG. 43: 210-214
(7) J Nucl Med 2002; Nakamoto Y, et al. PET/CT: comparison of quantitative tracer uptake between germanium and CT transmission attenuation-corrected images. 43: 1137-1143
(8) J Nucl Med 2002; Antoch G, et al. Focal tracer uptake: a potential artifact in contrast-enhanced dual-modality PET/CT scans. 43: 1339-1342
(9) AJR 2002; Goerres GW, et al. Positron emission tomography and PET CT of the head and neck: FDG uptake in normal anatomy, in benign lesions, and in changes resulting from treatment. 179: 1337-1343
(10) Radiology 2002; Hany TF, et al. PET diagnostic accuracy: improvement with in-line PET-CT systems: initial results. 225: 575-581
(11) Ann Thorac Surg 1998; Lowe VJ, Naunheim KS. Positron emission tomography in lung cancer. 65: 1821-29
(12) J Nucl Med 2002; Goerres GW, et al. Accuracy of image coregistration of pulmonary lesions in patients with non-small cell lung cancer using an integrated PET/CT system. 43: 1469-1475
(13) J Nucl Med 2003; Osman MM, et al. Clinically significant inaccurate localization of lesions with PET/CT: frequency in 300 patients. 44: 240-243
(14) J Nucl Med 2003; Cohade C, et al. Initial experience with oral contrast in PET/CT: phantom studies and clinical studies. 44: 412-416
(15) Radiographics 2003; Kostakoglu L, et al. Clinical role of FDG PET in evaluation of cancer patients. 23: 315-340
(16) Radiology 2003; Goerres GW, et al. Respiration-induced attenuation artifact at PET/CT: technical considerations. 226: 906-910
(17) J Nucl Med 2003; Dizendorf E, et al. Cause and magnitude of the error induced by oral CT contrast agent in CT based attenuation correction of PET emission studies. 44: 732-738
(18) J Nucl Med 2003; Tarantola G, et al. PET instrumentation and reconstruction algorithms in whole-body applications. 44: 756-769
(19) Radiology 2003; Nakamoto Y, et al. Effects of nonionic intravenous contrast agents at PET/CT imaging: phantom and canine studies. 227: 817-924
(20) J Nucl Med 2003; Bar-Shalom R, et al. Clinical performance of PET/CT in evaluation of cancer: additional value for diagnostic imaging and patient management. 44: 1200-1209
(21) J Nucl Med 2003; Karp JS, et al. Performance of a brain PET camera based on anger-logic gadolinium oxyorthosilicate detectors. 44: 1340-1349
(22) J Nucl Med 2003; Nehmeh SA, et al. Correction for oral contrast artifacts in CT attenuation-corrected PET images obtained by combined PET/CT. 44: 1940-1944
(23) J Nucl Med 2004; Czernin J, Schelbert H. PET/CT: facts, opinions, hopes, and questions. 45 (Suppl): 1S-3S
(24) J Nucl Med 2004; Townsend DW, et al. PET/CT today and tomorrow. 45 (Suppl): 4S-14S
(25) J Nucl Med 2004; Vogel WV, et al. PET/CT: panacea, redundancy, or something in between. 45 (Suppl): 15S-24S
(26) J Nucl Med 2004; Beyer T, et al. Acquisition protocol considerations for combined PET/CT imaging. 45 (Suppl): 25S-35S
(27) J Nucl Med 2004; Antoch G, et al. To enhance or not to enhance? 18F-FDG and CT contrast agents in dual modality 18F-FDG PET/CT. 45 (Suppl): 56S-65S
(28) J Nucl Med 2004; Wahl RL. Why nearly all PET of abdominal and pelvic cancers will be performed as PET/CT. 45 (Suppl): 82S-95S
(29) J Nucl Med 2004; Halpern BS, et al. Cardiac pacemakers and central venous lines can induce focal artifacts on CT-corrected PET images. 45: 290-293
(30) Radiology 2004; Antoch G, et al. Dual-modality PET/CT scanning with negative oral contrast agent to avoid artifacts: introduction and evaluation. 230: 879-885
(31) Radiographics 2004; Kapoor V, et al. An introduction to PET-CT imaging. 24: 523-543
(32)
(33) J Nucl Med 2004; Stabin MG. Proposed addendum to previously published fetal dose estimate tables for 18F-FDG. 45: 634-635
(34) J Nucl Med 2004; Lartizien C, et al. A lesion detection observer study comparing 2-dimensional versus fully 3-dimensional whole-body PET imaging protocols. 45: 714-723
(35) J Nucl Med 2004; Halpern BS, et al. Impact of patient weight and emission scan duration on PET/CT image quality and lesion detectability. 45: 797-801
(36) J Nucl Med 2005; Yau YY, et al. Application of intravenous contrast in PET/CT: does it really introduce signifncant attenuation correction error? 46: 283-291
(37) J Nucl Med 2005; Beyer T, et al. Optimized intraveous contrast administration for diagnostic whole-body 18F-FDG PET/CT. 46: 429-435
(38) J Nucl Med 2005; DiFilippo FP, Brunken RC. Do implanted pacemaker leads and ICD leads cause metal-related artifact in cardiac PET/CT? 46: 436-443
(39) Radiol Clin N Am 2004; Alavi A, et al. PET: a revolution in medical imaging. 42: 983-1001
(40) Radiol Clin N Am 2004; Surti S, et al. PET instrumentation. 42: 1003-1016
(41) Radiol Clin N Am 2004; Alessio AM, et al. PET/CT scanner instrumentation, challenges, and solutions. 42: 1017-1032
(42) Radiol Clin N Am 2004; Acton PD, et al. Quantification in PET. 42: 1055-1062
(43) J Nucl Med 2005; Halpern BS, et al. Optimizing imaging protocols for overweight and obese patients: a lutetium orthosilicate PET/CT study. 46: 603-607
(44) J Nucl Med 2005; Brix G, et al. Radiation exposure of patients undergoing whole-body dual-modality 18F-FDG PET/CT examinations. 46: 608-613
(45) J Nucl Med 2005; Brasse D, et al. Correction methods for random coincidences in fully 3D whole-body PET: impact on data and image quality. 46: 859-867
(46) AJR 2005; Nakamoto Y, et al. Accuracy of image fusion using a fixation device for whole-body cancer imaging. 184: 1960-1966
(47) J Nucl Med 2005; Coleman RE, et al. Concurrent PET/CT with an integrated imaging system: intersociety dialogue from the joint working group of the american college of radiology, the society of nuclear medicine, and the society of computed body tomography and magnetic resonance. 46: 1225-1239
(48) J Nucl Med 2005; Ford H. CT in PET/CT: essential features of interpretation. 46: 1249-1251
(49) J Nucl Med 2005; Osman MM, et al. Clinically significant incidental findings on the unenhanced CT portion of PET/CT studies: frequency in 250 patients. 46: 1352-1355
(50) J Nucl Med 2005; Pan T, et al. Attenuation correction of PET images with respiration-averaged C images in PET/CT. 46: 1481-1487
(51) J Nucl Med 2005; Schwaiger M, et al. PET/CT: Challenge for nuclear cardiology. 46: 1664-1678
(52) Radiol Clin N Am 2005; Jadvar H, et al. PET in pediatric diseases. 43: 135-152
(53) J Nucl Med 2005; Watson CC, et al. Optimizing injected dose in clinical PET by accurately modeling the counting-rate response functions specific to individual patient scans. 46: 1825-1834
(54) Radiology 2005; Krishnasetty V, et al. Comparison of alignment of computer-registered data sets: combined PET/CT versus independent PET and CT of the thorax. 237: 635-639
(55) J Nucl Med 2006; Lodge MA, et al. Comparison of 2-dimensional and 3-dimensional acquisition for 18F-FDG PET oncology studies performed using an LSO-based scanner. 47: 23-31
(56) AJR 2006; Mawlawi O, et al. Quantifying the effect of IV contrast media on integrated PET/CT: clinical evaluation. 186: 308-319
(57) Radiology 2006; von Schulthess GK, et al. Integretated PET/CT: current applications and future directions. 238: 405-422
(58) J Nucl Med 2006; Allen-Auerbach M, et al. Standard PET/CT of the chest during shallow breathing is inadequate for comprehensive staging of lung cancer. 47: 298-301
(59) J Nucl Med 2006; Pichler B, et al. Peformance test of an LSO-APD detector in a 7-T MRI scanner for simultaneous PET/MRI. 47: 639-647
(60) AJR 2006; Mawlawi O, et al. Truncation artifact on PET/CT: impact on measurements of activity concentration and assessment of a correction algorithm. 186: 1458-1467
(61) AJR 2006; Bruzzi JF, et al. Incidental findings on integrated PET/CT that do not accumulate 18F-FDG. 187: 1116-1123
(62) AJR 2006; Gilman MD, et al. Optimal CT breathing protocol for combined thoracic PET/CT. 187: 1357-1360
(63) J Nucl Med 2006; Kemp BJ, et al. NEMA NU 2-2001 performance measurements of an LYSO-based PET/CT system in 2D and 3D acquisition modes. 47: 1960-1967
(64) J Nucl Med 2007; O JH, et al. Clinical significance of small pulmonary nodules with little or no 18F-FDG uptake on PET/CT images of patients with nonthoracic malignancies. 48: 15-21
(65) Radiographics 2007; Prabhakar HB, et al. Bowel hot spots at PET-CT. 27: 145-159
(66) J Nucl Med 2007; Schoder H, Gonen M. Screening for cancer with PET and PET/CT: potential limitations. 48: 4S-18S
(67) J Nucl Med 2007; Kuehl H, et al. Can PET/CT replace separate diagnostic CT for cancer imaging? Optimizing CT protocols for imaging cancers of the chest and abdomen. 48: 45S-57S
(68) AJR 2007; Wong TZ, et al. Practical approach to diagnostic CT combined with PET. 188: 622-629
(69) J Nucl Med 2007; Surti S, et al. Performance of Phillips Gemini TF PET/CT scanner with special considerations for its time-of-flight imaging capabilities. 48: 471-480
(70) Radiology 2007; Blodgett TM, et al. PET/CT: form and function. 242: 360-385
(71) J Nucl Med 2007; Bacharach SL. PET/CT attenuation correction: breathing lessons. 48: 677-679
(72) J Nucl Med 2007; Vogel WV, et al. Evaluation of image registration in PET/CT of the liver and recommendations for optimized imaging. 48: 910-919
(73) J Nucl Med 2007; Gollub MJ, et al. Limitations of CT during PET/CT. 48: 1583-1591
(74) AJR 2007; Metser U, et al. Benign nonphysiologic lesions with increased 18F-FDG uptake on PET/CT: characterization and incidence. 189: 1203-1210
(75) Radiographics 2006; Blake MA, et al. Pearls and pitfalls in interpretation of abdominal and pelvic PET-CT: 26: 1335-1353
(76) J Nucl Med 2007; Federman N. PET/CT in evaluating pediatric malignancies: a clinician's perspective. 48: 1920-1921
(77) J Nucl Med 2008; Grant FD, et al. Skeletal PET with 18F-fluoride: applying new technology to an old tracer. 49: 68-78
(78) J Nucl Med 2008; Karp JS, et al. Benefit of time-of-flight in PET: experimental and clinical results. 49: 462-470
(79) J Nucl Med 2008; Townsend DW. Dual-modality imaging: combining anatomy and function. 49: 938-955
(80) J Nucl Med 2008; Zanzonico P. Routine quality control of clinical nuclear medicine instrumentation: a brief review. 49: 1114-1131
(81) Radiology 2009; Huang B, et al. Whole-body PET/CT scanning: estimation of radiation dose and cancer risk. 251: 166-174
(82) J Nucl Med 2009; Masuda Y, et al. Comparison of imaging protocols for 18F-FDG PET/CT in overweight patients: optimizing scan duration versus administered dose. 50: 844-848
(83) J Nucl Med 2009; Kadrmas DJ, et al. Impact of time-of-flight on PET tumor detection. 50: 1315-1323
(84) AJR 2009; Otero HJ, et al. Evaluation of low-density neutral oral contrast material in PET/CT for tumor imaging: results of a randomized clinical trial. 193: 326-332
(85) J Nucl Med 2009; Grgic A, et al. Nonrigid versus rigid registration of thoracic 18F-FDG PET and CT in patients with lung cancer: an intraindividual comparison of different breathing maneuvers. 50: 1921-1926
(86) J Nucl Med 2010; Lois C, et al. An assessment of the impact of incorporating time-of-flight information into clinical PET/CT imaging. 51: 237-245
(87) J Nucl Med 2010; Zanotti-Fregonara P, et al. Absorbed 18F-FDG dose to the fetus during early pregnancy. 51: 803-805
(88) AJR 2010; Lewellen TK. The challenge of detector designs for PET. 195: 301-309
(89) J Nucl Med 2011; El Fakhri G, et al. Improvement in lesion
detection with whole-body oncologic time-of-flight PET. 52:
347-353
(90) J Nucl Med 2011; Takalkar AM, et al. 18F-FDG PET
in pregnancy and fetal radiation dose estimates. 52: 1035-1040
(91) J Nucl Med 2012; Levin CS. Promising new photon detection
concepts for high-resolution clinical and preclinical PET. 53:
167-170
(92) J Nucl Cardiol 2012; Garcia EV. Physical attributes,
limitations, and future potential for PET and SPECT. 19: S19-29
(93) J Nucl Med 2012; Berker Y, et al. MRI-based attenuation
correction for hybrid PET/MRI systems: a 4-class tissue
segmentation technique using a combioned
ultras-short-echo-time/dixon MRI sequence. 53: 796-804
(94) J Nucl Med 2012; Drzezga A, et al. First clinical experience
with integrated whole-body PET/MR: comparison to PET/CT in
patients with oncologic diagnoses. 53: 845-855
(95) J Nucl med 2012; Buchbender C, et al. Oncologic PET/MRI,
part I: tumors of the brain, head and neck, chest, abdomen, and
pelvis. 53: 928-938
(96) J Nucl Cardiol 2013; Case JA, Bateman TM. Taking the perfect
nuclear image: quality control, acquisition, and processing
techniques for cardiac SPECT, PET, and hybrid imaging. 20: 891-907
(97) Radiology 2013; Catalano OA, et al. Clinical impact of
PET/MR imaging in patients with cancer undergoing same-day PET/CT:
initial experience in 134 patients - a hypothesis-generating
exploratory study. 269: 857-869
(98) J Nucl Cardiol 2013; Ademaw N, Salerno M. PET/MRI: current
state of the art and future potential for cardiovascular
applications. 20: 976-989
(99) J Nucl Med 2014; Kuhn FP, et al. Contrast-enhanced PET/MR
imaging versus contrast-enhanced PET/CT in head and neck cancer:
how much MR information is needed? 55: 551-558
(100) J Nucl Med 2014; Daube-Witherspoon ME, et al. Determination
of accuracy and precision of lesion uptake measurements in human
subjects with time-of-flight PET. 55: 602-607
(101) AJR 2010; Adams MC, et al. A systematic review of the
factors affecting accuracy of SUV measurements. 195: 310-320
(102) J Nucl Med 2014; Rauscher I, et al. PET/MR imaging in the
detection and characterization of pulmonary lesions: technical and
diagnostic evaluation in comparison to PET/CT. 55: 724-729
(103) J Nucl Med Supp 2014; Disselhorst JA, et al. Principles of
PET/MR imaging. 55: 2S-10S
(104) J Nucl Med 2015; Surti S. Update on time-of-flight PET
imaging. 56: 98-105
(105) J Nucl Med 2015; Ratib O. A perspective on the impact of
the shine-through artifact in clinical applications of PET/MR
imaging. 56: 815-816
(106) J Nucl Med 2015; Kolb A, et al. Shone-through in PET/MR
imaging: effects of the magnetic field on positron range and
subsequent image artifacts. 56: 951-954
(107) J Nucl Cardiol 2015; Beanlands
R, Heller GV. Proceedings of the cardiac PET summit meeting, 12
May 2014: Cardiac PET and SPECT instrumentation. 22: 563-570
(108) J Nucl Med 2015;
Zanotti-Fregonara P, et al. Fetal radiation dose from 18F-FDG
in pregnant patients imaged with PET, PET/CT, and PET/MR. 56:
1218-1222
(109) J Nucl Med 2016; Huellner MW,
et al. TNM staging of non-small cell lung cancer: comparison of
PET/MR and PET/CT. 57: 21-26
(110) J Nucl Med 2016; Sawicki LM, et
al. Evaluation of the outcome of lung nodules missed on 18F-FDG PET/MR compared with
18F-FDG
PET/CT in patients with known malignancies. 57: 15-20
(111) J Nucl Med 2016;
Zanotti-Fregonara P, et al. New fetal dose estimates from 18F-FDG administered during
pregnancy: standardized of dose calculations and estimations
with voxel-based anthropomorphic phantoms. 57: 1760-1763
(112) AJR 2019; You H, et al. Impact
of point-spread function reconstruction on 68Ga-DOTATATE PET/CT
quantitative imaging parameters. 683-688
(113) J Nucl Med 2020; Koopman D, et
al. Performance of digital PET compared with high-resolution
conventional PET in patients with cancer. 61: 1448-1454