PET CNS Imaging:
Normal CNS tracer distribution:
FDG uptake in the brain varies with patient age [71]. Infants
typically have a diffusely lower brain glucose metabolism, which
is approximately 30% of adult subjects [71]. Subsequently, there
is a rapid increase in brain glucose metabolism that begins after
4 months of age and reaches a peak level that is ultimately 30%
higher than that of adults by about 4 years of age [71]. The brain
glucose metabolic pattern in infants also reflects the functional
brain maturation, with the frontal and parietal association cortex
demonstrating lower FDG uptake (a pattern similar to Alzheimer
disease) and progressively increasing to 1 year of age when the
pattern becomes similar to adults [71]. FDG uptake in the brain is
usually symmetric in the frontoparietal and occipital regions, but
temporal lobe activity is often asymmetric across all age groups
with the left temporal lobe being hypometabolic in comparison to
the right side [71]. Depression and certain antiepileptic drugs,
such as phenobarbital and valproate sodium, have been shown to
cause diffusely decreased cerebral metabolic activity and
phenytoin can lead to decreased glucose metabolism in the
cerebellum [71].
Seizure Disorders:
(For more extensive discussion, see Tc-HMPAO seizure imaging in CNS section)
Epilepsy is one of the most prevalent
neurological disorders affecting 0.5-1% of the general population
[34,71]. Seizures can be classified as either partial (focal) or
generalized. Partial seizures originate in a given area of the
brain and can be divided into simple (with no impairment of
consciousness) and complex (with impairment of consciousness).
Most partial complex seizures originate in the temporal lobe. The
majority of patients can be treated effectively with antiepileptic
drugs, but up to 20-25% of patients with seizure disorders (and
over 40% of patients with complex partial seizures) may be
inadequately controlled (intractable epilepsy) [34,71]. Patients
unresponsive to anti-convulsant therapy may be candidates for
surgical treatment- particularly those with temporal lobe
epilepsy- if the patient has a focal epileptogenic abnormality and
early surgical resection has been shown to substantially improve
prognosis in these patients [71]. Surgery can decrease (in up to
92% of patients) or eliminate (up to 68% of patients) seizure
episodes, however, accurate localization of the seizure focus is
key for a successful post surgical outcome [34]. Unfortunately
scalp EEG often fails to accurately localize the seizure focus.
Depth EEG is much more accurate, but it is also extremely invasive
(requiring a craniotomy) and suffers from regional under sampling.
PET is very sensitive in the early detection of the functional
disturbance associated with microscopic neuronal disorganization
which results in epilepsy. EEG monitoring is recommended before
and during the FDG uptake phase to evaluate for seizure activity
that may have occurred [113]. During the interictal phase, PET
imaging with FDG will demonstrate a zone of decreased glucose
utilization and decreased cerebral blood flow (CBF) at the site of
a seizure focus in 60 to 70% of patients with normal MRI exams
[5]. In patients with intractable temporal lobe epilepsy,
interictal PET shows the hypometabolism near the seizure focus in
86% of patients (reported sensitivities 60-90% for patients with
temporal lobe epilepsy and 30-60% for extra-temporal lobe epilepsy
[41,113]) [34]. However, the area of reduced glucose metabolism
usually extends beyond the seizure onset zone [113]. Several
studies have shown that visual assessment of hypometabolism with
FDG PET is less accurate than quantification with a voxel-based
normalized comparison with reference templates of healthy patients
and co-registration with MRI [113]. Statistical parametric mapping
(SPM) is an automated objective voxel-based analysis technique in
which a patient's scan is compared to a matched healthy control to
aid in localization of abnormalities [55]. Quantification with SPM
aids in identification of the epileptogenic lobar regions and can
increase the diagnostic performance of FDG PET for seizure focus
detection [55,113]. SPM was found particularly useful in
identifying parasagittal cortical epileptic foci, which can be
missed on visual assessment [113].
A common FDG PET finding in epilepsy is the presence of
additional areas of hypometabolism in 10-43% of patients [113]. An
area of hypometabolism in the ipsilateral frontal lobe can be
found in 20% of patients and may represent inhibitory phenomena
induced by the epileptogenic focus [113].
It has been reported that the presence of cortical hypometabolism
may be associated with the duration, frequency, and severity of
seizures as it is seen less often in children with new onset
epilepsy (about 25% of cases) compared with 80-85% of adults with
intractable seizures [72]. Hypometabolism of the ipsilateral
thalamus can be seen in cases of focal epilepsy (medial temporal
lobe epilepsy being particularly associated with dorsal thalamus
hypometabolism) [72]. Contralateral cerebellar hypometabolism can
be seen in cases of frontal (mainly) or parietal lobe seizures
[72].
The distribution of the PET abnormality correlates very well with
the extent of the epileptogenic zone as determined by
intraoperative EEG, but correlates poorly with the extent of
morphological abnormalities in the resected specimen- the area of
hypometabolism is often much larger than the actual area of
structural abnormality [72]. FDG PET can also predict surgical
outcome, as ipsilateral PET hypometabolism appears to be
associated with a good outcome (86%) [72. Among patients
undergoing temporal lobectomy, a quantitative asymmetry index of
greater than 15% for the lateral temporal lobe indicates the
patient will likely have a good surgical outcome [6]. An odds
ratio of 7 has been reported for FDG PET in predicting a seizure
free outcome after epilepsy surgery [72].
The sensitivity of FDG PET in extratemporal lobe epilepsy is generally less (correct localization in 30-50% of patients) [41].
PET/MRI permits simultaneous acquisition of functional and
structural images [113].
Other PET agents have also been studied for the evaluation of seizures. Gamma-aminobutyric acid (GABA) is one of the most important inhibitory neurotransmitters in the CNS and has an important role in the regulation of seizure activity [113]. Benzodiazepine receptor imaging using C-11 flumazenil will demonstrate decreased activity within the involved medial temporal cortex at the seizure focus [29,113]. However, other areas of decreased uptake can also be seen in the cortex remote from the epileptic focus and the clinical utility of the agent is limited [113]. Opiate receptor imaging will demonstrate increased tracer uptake in regions of decreased FDG accumulation corresponding to the seizure focus [29].
|
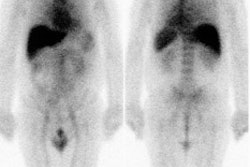
Inter-ictal FDG PET exam: The patient in the case below suffered from intractable drop seizures since the age of 18 months. An MRI was normal. Ictal scalp EEG demonstrated epileptiform activity emanating from the right parietal region. The FDG PET exam revealed a region of hypometabolism (red arrow) in the right parietal lobe. The PET exam guided subdural grid placement with very good correlation. The patient underwent surgical treatment and became seizure free. The exam was performed on an ECAT EXACT HR+ (manufactured by CTI). Case courtesy of Harry Chugani, M.D., Childrens Hospital of Michigan, and CTI PET Systems, Inc. |
|
|

In patients with Sturge-Weber syndrome, FDG typically shows widespread unilateral hypometabolism ipsilateral to the facial nevus [11]. In infants less than 1 year of age, however, the interictal scan often shows a paradoxical increased cortical metabolism ipsilateral to the facial nevus [11].
Cerebrovascular Disorders
Physiology, radiopharmaceuticals, and the PET exam:
Although the brain
comprises only 2% of the total body mass, it accounts for 20% of
the body's total basal oxygen consumption which is used almost
entirely for the oxidative metabolism of glucose (the exclusive
substrate for the brains energy metabolism) [80]. The brain
receives about 15% of the cardiac output [80]. Cerebral blood
volume, cerebral blood flow, the
cerebral metabolic rate of oxygen, and cerebral metabolic rate
of glucose all reflect various aspects of cerebral homeostasis.
Derangements in cerebral perfusion produce alterations in this
homeostasis that can be images with PET agents.
Cerebral blood
volume: With PET
imaging, the regional distribution of cerebral blood volume
(CBV) is imaged following the inhalation of C-11 (T1/2= 20.3
min.) or O-15 carbon monoxide (CO). Radiolabeled CO binds with
high affinity to hemoglobin within red blood cells (forming
carboxyhemaglobin) permitting absolute measurements of CBV.
Images of CBV show the greatest concentration of activity in the
dural venous and carotid sinuses. Although blood accounts for
only 5% of the volume of the gray matter structures, the gray
matter has a larger CBV than the white matter. The
normal whole brain CBV value is 4.2 ml/100gm.
Vasodilatation is
an early response to cerebral arterial occlusion and can be used
to identify areas of decreased perfusion pressure. The ratio of
CBV/CBF (cerebral blood flow) increases as cerebral perfusion
pressure falls.
Cerebral blood
flow: In the healthy
brain, cerebral blood flow is normally tightly coupled with
local metabolic needs [28]. Cerebral blood flow (CBF) can be
measured by using O-15 water intravenously (for scanners with
high count rate capabilities), O-15 carbon dioxide inhaled (for
scanners with limited count rate capabilities), or C-11 butanol.
O-15 labeled carbon dioxide is converted to radiolabeled water
by the action of carbonic anhydrase. The whole
brain average CBF is approximately 50 ml/100 gm/min [80].
The gray matter CBF is 2.5 to 3 times greater than that of the
white matter (80 versus 20 ml/100gm/min.) [80]. Electrical
activity in the brain diminishes at CBF values below 20
ml/100gm/min. and cell death occurs when the CBF falls below 10
ml/100gm/min.
Cerebral
metabolic rate of oxygen:
The cerebral metabolic rate of oxygen (CMRO2) is
measured using O-15 oxygen. A normal mean
regional CMRO2 is
approximately 3.0 ml O2/100gm/min-
with the gray matter consuming approximately 6ml/100g/min and
the white matter 2 ml/100g/min [80]. A minimum value of
at least 1.3-1.5 ml O2/100gm/min. is required for
tissue viability. CMRO2 is calculated from
measurements of CBF, CBV, and the oxygen extraction fraction
(OEF).
The oxygen
extraction fraction (OEF) represents the fraction of oxygen
extracted from the blood by the brain in a single capillary
transit and is approximately equal to 0.4. OEF increases as
blood flow decreases. OEF is calculated by using O-15 labeled O2
(O15O). Labeled O2 is extracted by the
brain and immediately metabolized to H2 15O.
OEF= CMRO2
/ CBF [arterial O2 concentration]
Cerebral
metabolic rate for glucose: The brain
accounts for 25% of total body glucose consumption at rest
[80]. Either F-18 fluorodeoxyglucose or C-11
deoxyglucose can be used to determine cerebral metabolic rate
for glucose (CMRglu). Unfortunately, C-11 deoxyglucose is a less
than optimal agent, because it is metabolized and the C-11
rapidly leaves the brain in the form of labeled CO2.
FDG crosses the blood brain barrier by a carrier mediated
transport mechanism similar to those operating for glucose. The
agent is phosphorylated into hexokinase, but not further
metabolized and it remains inside the neural cell.
Images are
performed approximately 40-60 minutes after tracer injection at
which time most blood-pool activity has cleared. There is generally homogeneous regional
utilization of glucose within the gray matter structures of
normal resting individuals (although a decline in frontal
metabolism has been reported with age).
Cerebral Infarction
In a normal resting
brain, cerebral blood flow, glucose metabolism, and the cerebral
metabolic rate for O2 are linked by a constant
relationship and the OEF is relatively homogeneous across the
brain.
In the early phase
of CVA or reduced cerebral perfusion pressure, blood flow is
maintained through autoregulated arteriolar vasodilatation
leading to an increase in regional cerebral blood volume (CBV)
[10,28]. When the vascular response is maximal and no further
dilatation is possible, rCBF will begin to decrease, however,
regional oxygen extraction fraction (rOEF) will begin to
increase in an effort to maintain a stable CMRO2
[10]. With mild to moderate decreases in CBF, neuronal function
can be maintained without compromise so long as OEF increases to
maintain CMRO2 (relatively preserved CMRO2
has been shown to be an indicator of preserved neuronal
integrity in regions with severely reduced CBF [100]). In severe
decreased blood flow (as CBF falls below 15-18 ml/100gm/min.),
oxygen extraction rises to maximal levels. Further decreases in
perfusion will then lead to the onset of ischemia and a decrease
in CMRO2. The presence of increased OEF has been
shown to be a powerful and independent predictor of subsequent
stroke in patients with atherosclerotic cerebral vascular
disease [7].
Regions with CBF of
12-22 mL/100g/min have an unstable metabolic situation and
infarction may develop if low flow persists [100]. PET studies
have allowed classification of three regions within areas of
disturbed vascular flow [100]. An area of oligemia with a flow
of greater than 22 mL/100gm/min which is not primarily damaged
by the lack of blood supply [100]. A penumbra region with a flow
of 12-22 mL/100gm/min containing tissue that is still
viable, but that has uncertain chances for infarction or
recovery [100]. And a region with rCBF below 11-12 ml/100gm/min.
or regional CMRO2 below 65 umol/100g/min that almost
always proceed to tissue necrosis [80,100]. There is usually a
surrounding penumbral region (CBF 12-22 ml/100 g/min) of still
viable tissue, but with uncertain chances for infarction or
recovery [80]. The condition of the tissue changes with time;
the extent of the penumbra and its conversion to infarction is a
dynamic process, and irreversible damages spreads from the core
of ischemia to its border [100]. Focal reductions in CBF and
CMRO2 mimicking acute infarction can be seen in
patients with other disorders such as cerebral hemorrhage,
multiple sclerosis, or infiltrating tumor. In general, CMRglu
measured with FDG tends to be lower in a site of hemorrhage
compared to acute ischemic infarction, although there is
considerable overlap.
In most cases of acute ischemic stroke, the CMRglu is reduced in the affected tissue; however, CMRglu may be increased above normal gray matter in some sections of the infarction in up to 10% of cases probably secondary to increased anaerobic glycolysis. In general, CMRglu is reduced less than CMRO2. During acute ischemia the CMRO2 appears to be the most important determinant of tissue viability. During the early portion of the post-infarction period, depending on the site and severity of obstruction, ischemic cerebral tissue may be salvageable. Tissue pH is reduced under conditions of acute ischemia, but is typically alkalotic by 5 days following the infarction.
By one week post infarction there is a reversal of the previous pattern noted- with persistent vasodilatation there is increased rCBF associated with decreased or unchanged glucose utilization due to decreased demand for oxygen metabolism in infarcted brain tissue [10,28. This uncoupling of flow and metabolism in which the CBF exceeds metabolic demands represents luxury perfusion. Although this phenomenon has typically been described as occurring in the subacute phase (72 hours or more after the onset of symptoms), hyperperfusion has been found as early as within the first 24 hours- possibly related to revascularization with development of collateral flow or from endothelial injury [53]. By one month post-infarct, a matched decrease in rCBF, rCMRO2, and glucose metabolism is seen indicating irreversibly infarcted tissue. Arteriovenous malformations (AVMs) also create a situation in which local blood flow greatly exceeds local oxygen utilization and cannot be distinguished from a subacute infarction with luxury perfusion by PET imaging.
| Condition | CMRO2 | CBV | OEF | CBF | CMRglu |
| Decreased flow reserve | Normal | Increased | Increased | Maximum possible | Normal |
| Acute ischemia | Decreased | Increased | Increased | Decreased | Generally reduced |
| Late infarct | Decreased | Variable | Normal | Decreased | Decreased |
PET imaging has also demonstrated widespread metabolic changes in structures remote form the site of infarction [10]. Crossed cerebellar diaschisis refers to a decrease in cerebellar blood flow and oxygen metabolism contralateral to the site of cerebral infarction during the first 2 months post event [10]. Interruption of the cerebro-ponto-cerebellar pathway is the proposed mechanism for this finding. Other remote function effects include decreased metabolism in the ipsilateral thalamus and caudate [10]. A decline in metabolic activity in the primary visual cortex ipsilateral to an infarct which involves the anterior visual pathways reflects a clinical homonymous hemianopsia.
Multi-infarct Dementia
MID is characterized by multifocal, asymmetric matched reductions of rCBF and rCMRglu corresponding to the locations of cortical and subcortical infarcts [8].
Arteriovenous Malformations
These lesions classically demonstrate increased regional cerebral blood volume ipsilateral to the malformation, associated with significantly decreased glucose metabolism.
Neuropsychiatric Disorders:
Dementia:
The most common cause of neurodegenerative disease in the oder population is Alzheimer disease [61]. PET imaging has been used for the assessment of dementia. When performing quantitative measurements on PET exams performed on elderly patients for dementia, it is important to remember to correct for age-related volume loss. Partial-volume averaging due to expanded sulci can result in PET measurements that underestimate true values [1]. When such corrections are made, it can be demonstrated that there is no decline in cerebral blood flow in healthy elderly individuals (except for the oribitofrontal cortex) [1,2]. A decline in dopamine activity with age, however, has been documented [2].
Mild cognitive impairment:
Symptoms and milder degrees of cognitive impairment precede the
dementia of AD by several years [61]. Mild cognitive impairment
(MCI) is considered a transitional stage between normal aging and
a dementia disorder- especially Alzheimer's disease (AD) [54]. MCI
is characterized by memory impairment or other cognitive function,
but with preserved activities of daily living [54]. It is
estimated that the prevalence of MCI rises from 6.7% for ages
60-64 years to 25% for ages 80-84 years [106]. About 12% of
patients with the amnestic form of MCI progress to AD each year,
and up to 80% by 6 years [54]. However, 30-40% of patients with
MCI do not progress at all [61]. Other authors state that MCI can
remain stable over 5 years in 50% of patients, but that 10-15% of
MCI patients progress to dementia annually [106].
Clinical:
Alzheimer disease (AD) is a progressive neurodegenerative
disorder associated with gradual deterioration in cognition,
function, and behavior [16]. Alzheimer disease is characterized by
the formation of two different insoluable protein aggregates- beta
amyloid plaques (which consist of aggregated beta-amyloid protein)
and neurofibrillary tangles (which consist of aggregates of
hyperphosphorlylated tau protein) [77]. A? deposition and NFTs can
lead to disruptions in axonal growth, axonal transport, and axonal
signal propogation [106].
Decreasing mortality with an ever greater elderly population has led to a rising prevalence of senile dementia [4]. AD is presently the most prevalent neurodegenerative disorder accounting for 50-80% of cases of dementia [40,54,61,93]. The prevalence of AD is below 1% in people aged 60-64y, but shows an almost exponential increase with age (doubling every 5 years after the age of 60 years) [35,61,93]. It is estimated that 8% of people over the age of 65 years suffer from Alzheimer's disease and the prevalence climbs with increasing age (about 25-30% in patients over the age of 85 years) [15,16,61]. The female to male prevalence of AD is 70%- likely related to the longer life expectancy of women [35]. Alzheimer's disease (AD) affects over 4 million people in the United States and the condition is tremendously costly to patients, their families, and society [4]. AD progresses incidiously with initial sparing of sensory and motor function [15,16]. Unfortunately, the condition frequently goes unrecognized or is not properly clinically diagnosed until it's more advanced stages [15,16].
The cause of AD is likely multifactoral [106]. Recent studies
have identified certain genetic risk factors for Alzheimer's
disease. Apolipoprotein (APOE), a gene on chromosome 19, has been
reported to have an association with late onset AD [57,61]. The
presence of APOE-4 allele increases the risk for AD, while the
APOE-2 allele appears to have a protective effect. Patients with
the APOE-4 allele may prove to benefit from early PET imaging in
order to identify changes suggestive of AD prior to the onset of
clinical symptoms. A rare familial form of AD also exists with
autosomal dominant inheritance and nearly 100% penetrance [32].
Three gene mutations have been linked to early-onset familial AD-
these are the genes for amyloid precursor protein, presenilin 1,
and presenilin 2 [61].
CSF fluid analysis is also used for the evaluation of suspected
Alzheimer disease [49]. A decrease in CSF beta-amyloid 1-42 (CSF
A?42) and increase tau level are felt to indirectly
reflect AD [49,65]. Elevated CSF tau levels correlate with
neurofibrillary pathophysiology at autopsy [65]. However, elevated
CSF tau levels are not specific for AD and can be seen in other
conditions such as stroke and head trauma [65].
The prodromal stage of AD is considered mild cognitive impairment
(MCI) which is defined by the presence of objective cognitive
impairment greater than expected for age, but without significant
functional decline and preservation of activities of daily living
[82,89,93]. Progression to AD has been reported in approximately
10-15% of MCI patients annually, however, not all cases of mild
cognitive impairment progress to AD [89,93]. The diagnosis of AD
is classified as "definite" if there has been histologic
confirmation, "probable" if there is typical clinical symptoms
without histologic confirmation, and "possible" if there are
atypical clinical features, but no alternative diagnosis is
apparent [63]. The clinical diagnosis of probable AD shows only
modest sensitivity (71-81%) and specificity (approximately 70%)
with the postmortem exam [87].
There is no cure for AD [61] However, accurate early diagnosis is very important as medications (cholinesterase inhibitors such as Donepezil hydrocholride, galantamine, and rivastigmine or the glutamatergic moderator memantine) are now available [61]. These agents have been shown to improve, stabilize, or delay the memory and other cognitive loss that occurs in mild to moderate disease [15,16,20,35,61]. A delay in the implementation of therapy may also have long term consequences [20]. Patients with AD in whom the start of cholinesterase inhibitor therapy is delayed demonstrate fewer benefits than do patients starting therapy early in the course of AD [35].
Pathology:
Pathologically AD is characterized by a reduction in the number
of large cortical neurons in the temporal and frontal cortex
(neuronal loss and atrophy) and by the appearance of senile or
amyloid plaques (extracellular deposits of beta-amyloid protein)
and neurofibrillary tangles (intracellular aggregates of tau
proteins that interfere with the assembly and stability of the
neuroskeleton) [16,38,54]. Tau protein is a phosphoprotein
component of the cytoskeletal microtubule system [65,104]. It's
role is stabilization of the microtubules which is critical for
intracellular transport and cytoskeletal support [104]. In AD, tau
becomes hyperphosphorylated, dissociates from microtubules,
assumes a paired helical filament configuration, and is what forms
insoluable neurofibrillary tangles inside neurons [65]. The
mechanisms leading to tau hyperphosphorylation and aggregation
have not been fully elucidated [104].
It should be noted that about 30% (20-40% [73] of cognitively
normal elderly subjects have AD pathologic features at autopsy-
typically characterized by neocortical diffuse amyloid plaques,
but no extensive neurofibillary tangles (suggesting that amyloid
develops first, while the neurofibillary tangles appear later
[65]. Also- in patients with AD, amyloid accumulation does not
parallel cognitive decline [73]. Longitudinal studies suggest that
amyloid deposition tends to plateau early in the presymptomatic or
prodromal phases [73]. This suggests that amyloid imaging may be a
good biomarker for early detection of preclinical or early mild
AD, rather than as a means of tracking AD progression [73].
Cerebral metabolic rate for glucose primarily reflects neuronal and synaptic activity, and at autopsy patients with Alzheimer's are found to have an average decrease of 50% in the density of the granular neurophil in the parietal and temporal cortices [8]. The greatest density of neuritic plaques and neurofibrillary tangles are also found in these locations [8].
PET imaging in Alzheimer's disease:
FDG PET can improve diagnostic accuracy in the evaluation of
patients with cognitive decline (mild cognitive impairment or MCI)
above clinical, imaging, and biomarker assessment [63,67].
Patients with mild cognitive impairment do not have dementia, but
are at a 10 times higher risk for developing dementia compared to
the general population [35,43]. Longitudinal studies have
indicated that individuals with MCI decline to AD at a rate of 12%
per year and up to 80% at 6 year followup [48]. PET FDG imaging is
currently used primarily as an adjunct to the clinical
determination of AD and is especially useful in differentiating AD
from other dementias (including vascular dementia). [16,17]. FDG
PET imaging has demonstrated promise in providing a diagnosis of
AD 2 to 3 years before full dementia-related symptoms manifest
[16]. This observation of a reduction in metabolism in
presymptomatic patients indicates that the pathophysiologic
process begins before the condition is recognized clinically [35].
By confirming the diagnosis of AD, PET imaging allows for the
early institution of appropriate therapy. Also- patients with
negative PET scans, can be spared the expense of unnecessary
treatment as data indicates that a negative PET scan strongly
favors a nonprogressive outcome [63]. However, other authors have
found the NPV of FDG imaging in patients with MCI to be low
(65-78%) [89].
Presently, the available literature would also support the use of
PET imaging for at least 2 groups of patients- those with mild or
moderate cognitive impairment who meet the standard criteria for
dementia (the cause of which has not been identified by an
appropriate medical workup); and those patients with mild or
moderate cognitive impairment who exhibit progressive cognitive
dysfunction that has not reversed after a thorough medical workup
[20].
Patient preparation/Imaging: The patient should fast for at least
4 hours prior to the exam [75]. A standard dose of 5-10 mCi of FDG
is used for the exam [75]. Serum glucose should be recorded with a
level under 140 mg/dL being mosr desireable, although this cannot
always be achieved in diabetics [75]. After injection, the patient
should remain in a quiet, darkened room and should be instructed
to stay awake, keep their eyes open, and not verbalize [75]. If
the patient's eyes are closed, there may be occipital lobe
hypometabolism (which can mimic DLB) [75].
Elevated plasma glucose levels can affect the cerebral
distribution of FDG resulting in reduced FDG uptake in the
precuneus (the portion of the parietal lobe posterior to the
sensory-motor cortex and anterior to the occipital lobe) producing
an AD-like pattern in cognitively normal individuals [83]. This
pattern is reversible when glucose levels are normal [83].
Although it is usually recommended to reschedule FDG brain imaging
if the glucose level is greater than 150 mg/dL, even mildly
elevated glucose levels (100-110 mg/dL) can be associated with
this pattern of reduced activity in the rpecuneus [83].
Certain drugs can also affect cerebral metabolism- diazepam
has been shown to reduce cerebral glucose metabolism globally by
20% [75]. It is recommended that benzodiazepine used for sedation
be administered following the 30 minute FDG uptake phase [75].
Imaging is typically performed 30 minutes after tracer injection
using a 3-dimensional image acquisition mode [75].
Normal patients: In healthy patients, the most intense FDG uptake
occurs in the subcortical putamen, caudate nucleus, and thalamus,
followed by high uptake in the cortical gray matter [75]. The
white matter is relatively photopenic [75].
Findings in AD: AD classically produces a pattern of bilateral parietotemporal hypometabolism [3] (which can be asymmetric early in the course of the disease [16,20]). The posterior cingulate gyri/cortex (involved with memory related functions) and the neighboring precuneus are affected in the earliest clinical and preclincal stages of AD and hypometabolism may be limited to these regions [63,75,82,93]. The medial temporal lobes- particularly the hippocampus- are also hypometabolic in AD (hippocampal glucose metabolic reductions appear to precede those in the cortical regions in cognitively normal patients before symptoms become clinically evident) [40,63,82]. There is relative sparing of the basal ganglia, thalamus, cerebellum, visual cortex, and cortex mediating primary motor and sensory functions [20,93]. The sensorimotor cortex may appear more conspicuous when contrasted with adjacent hypometabolism [75]. Abnormalities on FDG PET imaging occur even before substantial abnormalities appear on clinical or neuropsychiatric tests [8]. The combination of reduced metabolic activity in a suspicious distribution and genetic risk factors provides a means for the detection of pre-clinical disease [18]. In advanced AD, hypometabolism will also involve the frontal lobes [40].
PET FDG imaging has been shown to have a sensitivity of 92-96%, specificity of 63-89%, and an accuracy of 82-90% for the confirmation of Alzheimer's in patients that are difficult to characterize on clinical evaluation [3,4,25]. In a meta-analysis of PET data in Alzheimer's disease, the summary sensitivity was 86% (95% CI: 76%-93%) and the summary specificity was 86% (95% CI: 72%-93%) [19]. A metaanalysis of case-control studies since the year 2000, using clinical assessment as a reference standard, found FDG PET imaging to have an overall sensitivity of 96%, a specificity of 90%, and an accuracy of 93% [63]. In a study of 138 patients with a pathologically confirmed diagnosis, PET correctly identified the presence or absence of AD in 88%, with a sensitivity of 94% (89-99%; 95% CI), and a specificity of 73% (60-87%, 95% CI) [17]. The patients in this study were generally felt to have mild cognitive impairment at the time of their initial PET exam [17]. In another prospective study of patients with mild cognitive impairment (MCI) [25], PET correctly identified patients that would progress to Alzheimer's with a sensitivity of 92% and a specificity of 89%. However, the high conversion rate from MCI to AD in this study (40%) may have contributed to the very high sensitivity [25]. This study also used an automated image analysis program (NEUROSTAT) to aid in image interpretation [25]. Programs such as NEUROSTAT provide advantages in objectivity, reproducibility, and speed of image analysis as a result of automatic anatomic standardization and statistical processing [26,40]. In a comparison to 18F-florbetapir, FDG imaging yielded a significantly higher predictive value for progression from MCI to Alzheimer, however, both imaging modalities were found to be inferior to a non-imaging model [110]. Still- the best prediction accuracy was reached by combining FDG PET, amyloid PET, and non-imaging variables (APOE, FAQ, and MMSE) which yielded a 5-year free conversion rate of 100% for the low risk group, 64% for the intermediate risk group, and 24% for the high risk group [110].
PET imaging can aid in physician confidence in the diagnosis of
AD [63]. In one study of patients with MCI, the results of the PET
scan were associated with a change in diagnosis in 29% of patients
[63]. PET scan findings helped to clarify the diagnosis in 56% of
cases and confirm the clinical impression in 16% of cases [63].
PET imaging can also improve the accuracy in identifying early
Alzheimer's without adding to the overall costs of diagnosis and
treatment [15]. In patients presenting with cognitive symptoms, a
negative PET indicates a lower likelihood for a progressive
dementia with a specificity of about 76% [17].
PET versus SPECT for AD: FDG PET has been shown to be superior to SPECT imaging for the evaluation of AD [81]. When compared to SPECT imaging, reductions in tracer activity are significantly more pronounced for PET imaging [14]. The magnitude of the deficits on PET also correlates with the degree of cognitive impairment [16] and the correlation between dementia severity and the number of abnormal voxels is closer for PET than for SPECT [14]. Metabolic activity in the primary sensory-motor cortex, basal ganglia, thalamus, and cerebellum are typically normal in patients with Azlheimer's disease [16]. In one study comparing FDG PET and SPECT, the sensitivity and specificity for dementia vs no dementia were 85% and 90% for PET, and 71% and 70% for SPECT [81]. Overall, for the detection of AD, PET has an increased accuracy of 15-20% compared to SPECT imaging [20].
PET imaging has also been shown to be superior to MR voxel-based morphometry (VBM) for the identification of AD, particularly in the early stage of the disorder [39].
|
Alzheimer's disease on FDG PET: The case below is from an 86 year old male being imaged to exclude Alzheimer's disease. The FDG PET exam demonstrated bilateral temporoparietal hypometabolism. This finding is very sensitive for the diagnosis of Alheimer's disease. The exam was performed on an ECAT EXACT HR+ PET scanner (manufactured by CTI) after administration of 108 MBq FDG. The exam was acquired using a 3D dynamic emission and 15 minute transmission protocol. Case courtesy of Institut fur Medizin Forschungszentrum Julich, Germany and CTI PET Systems, Inc. |
|
|

The pattern of biparietotemporal hypometabolism is not absolutely pathognomonic for Alzheimer's and can also be seen in patients with Parkinson's disease with dementia [20], bilateral parietal subdurals [8], dementia with Lewy bodies (but will also involve the visual cortex) [16], Creutzfeldt-Jacob disease [3], or biparietotemporal infarctions [8].
The global CMRglu has also be evaluated in patients with AD and
is reduced in up to 35% of Alzheimer's patients. However, this may
also be seen in patients with depression, Parkinson's, following
convulsion, trauma, cerebral irradiation, ECT therapy, and with
drug induced impairment of consciousness. CMRglu also decreases
normally in the elderly, despite maintenance of CBF, and CMRO2.
Diabetic patients with poor glycemic control have also been shown
to have reduced glucose metabolism in AD regions on PET imaging
(with amyloid plaque accumulation) [74].
Abnormalities within the cholinergic system have been consistently identified in patients with Alzheimer's. There is a 40 to 90% decrease in the enzyme choline acetyltransferase and consequently in acetylcholine levels within the cerebral cortex. In contrast, the dopaminergic system is not abnormal in Alzheimer's patients (as it is in patients with Parkinsons).
Imaging amyloid plaques:
Cerebral amyloid accumulation appears to start decades before the
onset of dementia [82]. Amyloid plaque imaging permits
demonstration of a specific biomarker for AD [65]. These new
radiotracers hold promise for imaging patients with AD [16].
However, about 30% of cognitively normal elderly subjects have
abnormal findings on PET amyloid imaging studies [65,114]. The
prevalence of cerebral amyloid increases from 10-15% at age 65 to
about 50% at age 85 [82]. Older age, APOE*E4 genotype, and a
family history of AD are all associated with greater amyloid PET
binding in cognitively normal individuals [65].
A meta-analysis of amyloid plaque imaging found a prevalence of
88% positive exams in AD dementia (negative exams were most
commonly observed in older APOE*E4 noncarriers) [87]. However-
amyloid positive exams were also seen in 51% of patients with DLB,
30% of patients with vascular demntia, and 12% of patients with
FTD (and the likelihood for a positive scan increased with patient
age) [87]. Positive Florbetapir imaging has been reported in up to
25% of patients with FTD [84,85]. Because of a very high
positivity of amyloid imaging in patients with APOE*E4, imaging
may not be justified in these patients when they display classic
AD findings [87].
Quantification of Aβ PET radioligand retention can be used to detect changes in Aβ plaque burden over time in response to anti-Aβ treatment [108]. SUV ratios are commonly used as a semiquantitative measure of Aβ burden, calculated by normalizing Aβ PET radiotracer retention values from a targeted brain region of interest to a reference region that is not expected to accumulate amyloid [108]. Several factors contribute to variability in measuring change in amyloid plaque density longitudinally including partial volume effects associated with the limited spatial resolution of PET imaging, meaningful physiologic changes due to underlying disease, the tracer used, consistency of acquisition conditions (patient positioning in the field of view), and tracer quantification method (distribution volume ratio versus SUR) [86,108]. Measurements of cortical tracer retention can also be contaminated by nonspecific tracer retention in white matter - therefore, lack of stability in white matter retention could lead to spurious changes in measured cortical activity [86]. Selection of an appropriate reference region that is expected to remain free of fibrillar amyloid deposition over time is of particular concern [86]. The whole cerebellum has been used frequently for florbetapir normalization [86]. However, the low position of the cerebellum in the field of view may introduce artifacts due to image truncation, alterations in scatter, attenuation correction, and counting rate and sensitivity [86]. None-the-less, the specific reference region does not seem affect the overall ability to detect Aβ reduction [108].
Appropriate use criteria for amyloid imaging include: 1-
persistent or progressive unexplained mild cognitive impariment;
2- the core clinical criteria for possible Alzheimer disease are
satisified, but there is an unclear clinical presentation- either
an atypical clinical course or an etiologically mixed
presentation; or 3- patients with progressive dementia and
atypically early age of onset [107].
11C-Pittsburgh Compound-B (PIB):
11C-Pittsburgh Compound-B (PIB) is one agent that
primarily reflects Aβ-related
cerebral amyloid (it binds with high affinity to Aβ plaques, but not to neurofibrillary
tangles) [43,54]. The agent can aid in differentiating AD
from FTD which is not characterized by β-amyloid plaques [56]. Evidence suggests that
cerebral Aβ amyloidosis starts 10 to
15 years before the first cognitive symptoms [58]. Imaging is
typically performed 40-50 minutes following tracer injection
[61]. Most exams are interpreted using the cerebellar gray
matter as a reference region [61]. The ratio of cerebellar to
cortical binding provides a reliable measure of the brain
amyloid burden [61]. The upper limit of normal is between 1.3
and 1.6 [61]. Scans interpreted by visual inspection correlate
well with the SUV ratio cutoff for positive exams [61].
A drawback of PIB imaging is that an on-site cyclotron is
required for 11C production [44]. However, attempts
are being made to label the compound with 18F [47].
Also, PIB uptake does not correlate with the severity of dementia
as FDG does [56,61]. PIB uptake can also be seen in diseases with
AD pathology such as Lewy body dementia and up to 30% of healthy
elderly people may demonstrate positive scans in an age related
manner (positive scans occur in 12% of healthy patients in their
60s, 30% in their 70s, and at least 50% of those over 80 years of
age) [58,61].Positive PIB scans in asymptomatic elderly patients
is strongly related to the presence of APOE-4 allele- which is
carried by 27% of the general population [61]. The retention of
PIB in healthy individuals is associated with a greater risk of
cognitive decline and a faster rate of brain atrophy [61].
11C-PIB scans are positive in 50-60% of individuals
with MCI [61]. A negative 11C-PIB scan in a MCI
patient carries a high negative predictive value for short term
progression to AD (NPV up to 100% in one study) [89]. Less than
10% of PIB negative MCI patients progress to a clinical diagnosis
of AD, but 20% will progress to another type of dementia such as
dementia with Lewy bodies or frontotemporal dementia [61]. The
test-retest error rate for the PIB standardized uptake value
ratios is approximately 5-9% [86].
18F-labeled radioligands:
Three 18F-labeled radioligands for brain imaging are available- florbetaben, florbetapir (approved for imaging), and fluremetamol [61]. A positive scan demonstrating Aβ deposition in the brain is not diagnostic of AD [92]. A major limitation of amyloid PET to support a diagnosis of AD dementia is the high prevalence of amyloid positivity in normal older individuals [68]. Estimates of age-specific positivity rates for amyloid PET are less than 5% in patients 50-60 years, 10% in patients 60-70 years, 25% in those 70-80 years, and more than 50% in persons aged 80-90 years [68]. Also- amyloid PET is frequently positive in dementia with Lewy bodies [68]. Additionally, amyloid imaging detects fibrillar amyloid found in blood vessels (cerebral amyloid angiopathy) as well as interstitial fibrillar amyloid plaques [68]. Hence, it cannot distinguish between amyloid angiopathy and AD [68]. Therefore, amyloid positivity does not establish a diagnosis of AD or differentiate it from other disorders such as dementia with Lewy bodies and cerebral amyloid angiopathy [68]. A such, amyloid PET imaging is only an indicator of underlying pathology which can be useful when a particular clinical syndrome has been identified and other explanations have been adequately considered after a proper clinical evaluation [70]. Therefore, amyloid PET is limited to a subset of cognitively impaired patients, and then only under specific circumstances with the following prerequisites- a cognitive complaint with objectively confirmed impairment; AD is a possible diagnosis, but when the diagnosis is uncertain after a comprehensive evaluation by a dementia expert; and when knowledge of the presence or absence of Aβ pathology is expected to increase certainty and alter management [70]. Evidence suggests a change in diagnosis following amyloid imaging in about 30% of patients, an increase in diagnostic confidence in about 60% of cases, and a change in patient management in about 60% of cases, specifically to a change in medication in about 40% of patients [102]. Importantly, a negative result indicates the patient is unlikely to have AD and negative results in MCI patients indicates the patient is unlikely to advance to AD dementia [92].
No drug withdrawal is presently required for amyloid plaque imaging [92]. The risk of adverse events caused by the radiotracer is less than 2% and may include HA, nausea, dizziness, flushing, musculoskeletal pain, or an injection site reaction [92]. The radiation exposure from an amyloid PET study is about 4-7 mSv [92].
Florbetapir: The agent 18F- florbetapir has rapid
brain uptake and binds to beta amyloid plaques (the agent washes
out of normal gray matter not containing amyloid) [59,64]. The
recommended dose is 10 mCI, but doses as low as 3 mCI can be used
without a significant decrease in the diagnostic quality of the
exam [64]. Imaging is started 50 minutes following tracer
injection [61].
A negative amyloid PET scan normally demonstrates white matter
uptake and little or no binding in the gray matter (there is a
clear gray-white matter contrast) [92]. Some key features include
a diamond-shaped clear space along the interhemispheric fissure
between the frontal lobes and a "cartoon hand" appearance to the
white matter uptake in the frontal region [107]. A "double convex
lens" sign represents an area of decreased activity between the
cerebral hemispheres along the flax [107].
A key feature for a positive exam is loss of the gray-white
matter contrast, with tracer uptake extending to the edge of the
cerebral cortex [92]. The cerebellar cortex is also expected to be
free of Aβ deposition except
in the most advanced stages of AD (cerebellar amyloid deposition
can also be seen in patients with Down syndrome [95]) [92,95]. A
scan is considered positive for AD if there activity in the
cortical gray matter regions relative to the cerebellum [66].
Abnormal tracer uptake tends to be symmetric [92]. Cortical
regions demonstrating the most distinct accumulation in Aβ positive patients include the
lateral temporal and frontal lobes, the posterior cingulate
cortex/precuneus, and the parietal lobes [92]. The sensorimotor
cortex and visual cortex can be relatively spared [92]. There will
be loss of the diamond-shaped clear space between the frontal
lobes and rather than a convex area of decreased activity between
the cerebral cortices, there will be a "kissing hemispheres" sign
with activity extending to the falx [107].
When interpreting the exam, the impression should state clearly weather the scan demonstrates Aβ deposition in the brain or not (positive or negative for Aβ deposition) [92]. The impression should not state "the exam is diagnostic for Alzheimer disease" [92]. Sites of Aβ deposition are often discordant with sites of hypometabolism on FDG imaging [106].
Some scans may be difficult to interpret because of image
blurring related to patient motion and/or atrophy with a thinned
cortical ribbon [92]. Atrophied brain may lead to false-positive
results due to over-estimation of tracer uptake in the thinned
gray matter due to spillover from white matter uptake [92,107].
There is only modest interobserver agreement for visual exam interpretations [84] and subjective visual assessment is equal to, if not preferred over, quantitative analysis [106]. For quantitative analysis, a cortical-to-cerebellum ratio (SUVr) can be calculated [64]. A SUVr of greater than 1.1 may be considered positive for beta-amyloid plaques [64], although other authors indicate a ratio greater than 1.3-1.6 is considered positive for amyloid deposition [78]. The degree of binding does not appear to correlate with minimental status exam score [66]. There is a high test-retest reliability with Florbetapir [64]. In a post mortum study of a small number of patients, the presence or absence of Florbetapir uptake correlated with the autopsy findings in 96% of cases [59]. The sensitivity has been reported to be 95% and the reported specificity is 95% [66].
Florbetaben: Another agent is 18F-florbetaben that
binds to amyloid plaques and has been shown to distinguish
patients with AD from FTLD [60]. Imaging is strated 80-90minutes
follwoing tracer administration [61]. In a study using
Florbetaben, cortical atrophy was found to affect quantitative
analysis of PET beta-amyloid imaging resulting in apparent
diminished uptake [88]. Partial volume effect correction improves
quantitative analysis in patients with cortical atrophy [88].
Fluremetamol: 18F-fluremetamol is structurally
identical to 11C-PIB and the agent performs similarly
to PIB with a sensitivity of 93% and a specificity of 96% [62].
Automated quantification using the pons as a reference region has
demonstrated a sensitivity of 91% and specificity of 88% [79]. The
agent frequently demonstrates striatal binding on positive scans
producing a striatal bridge (on negative studies there is a
striatal gap) [107].
18F-FDDNP: The agent [18F] FDDNP targets
amyloid senile plaques and neurofibrillary tangles and will show
increased temporal-parietal accumulation of the tracer in AD [16].
In studies, a greater degree of 18F-FDDNP tracer
accumulation correlates with decreased memory performance scores
and decreased glucose metabolism on FDG PET imaging [18]. Both PIB
and FDDNP have been shown to be able to distinguish AD from
controls, but PIB binding is usually higher and there is less
overlap with controls (studies have shown that PIB uptake in AD
patients is nearly twice that in controls in specific cortical
areas [45]) [43].
Tau/neurofibrillary tangle imaging: 111
18F-flortaucipir: AD pathology is characterized by
accumulation of tau-containing neurofibrillary tangles and amyloid
plaques [105]. Accumulation starts in the transentorhinal cortex
before spreading to the medial and inferior temporal lobe, the
parietal-occipital regions, and the rest of the neocortex [111].
Although amyloid pathology is invariably present in AD, it is not
consistently associated with the severity of the clinical features
or disease duration [105]. In contrast, the severity of cognitive
impairment in AD parallels the tau burden/level of neocortical NFT
pathology, as well as progression [1-5,111]. Neocortical AB
plaques and age related limbic neurofibrillary tangles are also
common in non-demented individuals, but neocortical
neurofibrillary tangles are much less prevalent [105].
The distribution of neurofibrillary tangles (NFTs) in AD is
classified into four stages [111]:
B0- no NFTs
B1- Braak stages I/II- NFTs predominantly in the entorhinal cortex and closely related areas
B2- Braak stages III/IV- abundant NFTs in the hippocampus and amygdala, with some extension into the associated cortex
B3- Braak stages V/VI- NFTs widely distributed throughout the neocortex
A level of B2 tau pathology with coexisting beta-amyloid and
neuritic plaques is necessary to confer a diagnosis of AD [111].
The agent 18F-flortaucipir images tau neuropathology
and binds with high affinity to paired helical filament tau in
neurofibrillary tangles [109]) [105].
Studies have shown rapid uptake of the agent in the brain and
subsequent clearance from the white matter (unlike the white
matter retention seen with amyloid imaging agents) [105]. For scan
interpretation, the amount of 18F-flortaucipir uptake
in the neocortical gray matter regions is evaluated [111]. A
positive scan typically shows widespread neocortical activity in
the posterolateral temporal, occipital, parietal and precuneus,
medial prefrontal and cingulate, and lateral prefrontal regions
[111]. There is a high probability for correctly identifying
patients with B3 tau pathology (sensitivity 92%-100%) [111]. There
is lower sensitivity for B0, B1, and B2 tau pathology and
therefore, patients with meaningful tau pathology (B2) may be
missed [111]. To summerize- a positive flortaucipir scan indicates
the presence of widely distributed tau neuopathology (B3) in the
neocortical areas [111]. A negative scan does not rule out the
presence of B2 or lower tau pathology or amyloid pathology [111].
Between 15-25% of patients with elevated AB-amyloid who are
clinically diagnosed as having probable AD have subthreshold
levels of cortical tau tracer retention [114].
A negative scan typically demonstrates no increased neocortical
activity or shows increased neocortical activity isolated to the
mesial temporal, anteriolateral temporal, or frontal regions
[111]. Other authors have also commented that in healthy patients,
18F-flortaucipir scans have shown tau accumulation that
is mostly restricted to the medial temporal lobes. Iron
accumulation and age correlate with 18F-flortaucipir
in the basal ganglia of healthy controls suggesting that iron or
ferritin is a possible source of off-site binding of the agent
[109]. The agent also binds to neuromelanin which increases with
age [109]. Additional off-target binding of the agent has also
been described in the basal ganglia, chorid plexus, and substantia
nigra [114].
Former football players with chronic exposure to trauma show an
anterior pattern of flortaucipir retention in the prefrontal
regions and the MTL, quite distinct from the posterior pattern
observed in AD [114].
PET/MR in dementia imaging:
Compared to AC PET/CT, one study has suggested that AC PET/MR
images demonstrate significantly lower relative tracer signal in
the frontoparietal portions of the neocortex, but relatively
higher signal in the subcortical and basal regions including the
anterior and posterior cigulate gyri, putamen/thalamus,
hypothalamus, pons, cerebellum, and inferior frontal cortices
[76]. These differences can have implications for quantitative
analysis when assessing for dementia patterns [76]. The
discrepancies are less pronounced on NAC images, but still persist
suggesting that this may be a consequence of general differences
in scanner geometry, in detector technology, in scatter
characteristics, or patient position in the scanner [76].
MR imaging in AD:
Typical structural changes seen in AD occur late in the disease
process [93]. The hallmark finding of AD on MR is hippocampal
atrophy [82]. The average hippocampal volume reduction is 20-25%
in AD and 10-15% in MCI [82]. Progressive hippocampal volume loss
over 12-18 months increases the sensitivity for AD [106].
Disproportionate volume loss can also be seen involving the
amygdala and temporal parietal lobes with relative sparing of the
primary sensorimotor cortex [93,106].
Dementia with Lewy bodies (DLB) is a primary degenerative dementia characterized by substantial loss of nigrostriatal dopaminergic terminals, together with the presence of Lewy bodies in cortical, subcortical, and brain stem structures, and and Lewy neurites [33,69]. A significant number of DLB patients also exhibit neuritic plaques composed of fibrillar amyloid precursor protein fragments (A?) amyloid) [69]. It is the second most common degenerative dementia after Alzheimer's disease- accounting for up to 15-25% of cases of dementia in older patients [33,35,37,51,75,97]. Patients present with the clinical triad of fluctuating cognitive impairment with pronounced variations in attention and alertness, recurrent detailed visual hallucinations, and spontaneous Parkinson-like symptoms (seen in 790% of patients), as well as visual spatial problems [16,35,54,78]. DLB is distinguished from Parkinson disease dementia by presentation of dementia before or within one year of the onset of parkinsonian movement symptoms [82,93]. Two core features are necessary for a diagnosis of probable DLB, while the presence of one feature is consistent with possible DLB [37]. Based upon the clinical exam, the sensitivity for the diagnosis of probable DLB ranges from 22-83% (specificity from 79-100%) [37].
Cholinesterase inhibitors are currently the treatment of choice for DLB [16, 37]. However, neuroleptic medications can induce life threatening extrapyramidal reactions and should be avoided in DLB patients [37].
FDG PET imaging can be used to aid in differentiation of AD from
DLB [63]. On FDG PET imaging there are bilateral temporal-parietal
deficits similar to Alzheimers (AD), but the deficit also involves
the occipital lobes (visual cortex) and cerebellum (areas
typically spared in AD) [16]. One study using post mortum
diagnostic validation found that glucose hypometabolism in the
primary visual cortex distinguished DLB from AD with 90%
sensitivity and 80% specificity [51,63]. Although reduced
metabolic activity is seen in the occipital lobe, it is not
affected histopathologically [33]. A preservation of metabolic
activity in the posterior cingulate gyrus relative to the
precuneus and cuneus (cingulate island sign) has also been
described as being characteristic for DLB (100% specific;
sensitivity 62-82%) [51,106]. Sparing of activity in the primary
visual cortex is referred to as the "occipital tunnel" sign [106].
Greater hypometabolism is correlated with more severe dementia
[82].
Because of the presence of amyloid plaques, between 50-70% of patients with DLB demonstrate cortical tracer uptake on amyloid PET imaging (aymyloid plauqes are not seen in patients with Parkinson disease) [69,78]. Other authors suggest that at least 70-80% of DLB patients have cerebral amyloid plaque [82]. 123I-ioflupane imaging demonstrates variable patterns of decreased dopaminergic activity [78]. This can aid in differentiating DLB from Alzheimer disease which demonstrates preserved dopaminergic activity [78].
Imaging with dopamine transporter agents (I123-isoflupane) can
also help to distinguish DLB and AD if the occipital cortex is not
involved [75]. An Alzheimer disease pattern of hypometabloism and
a positive dopamine transporter scan with loss of dopaminergic
neurons in the substantia nigra and reduced striatal dopaminergic
activity indicate that DLB is the most likely diagnosis [75].
Patients with dementia with Lewy bodies have also been found to
display a significantly lower myocardial 123I-MIBG
uptake in comparison to healthy controls and other patients with
Parkinsonian symptoms [99].
Posterior cortical atrophy (PCA) can also
produce occipital hypometabolism on FDG PET imaging, as well as
decreased uptake in the precuneus, posterior cingulate, and
temporal parietal lobes [101,106]. Patients with PCA present
with a progressive decline in visuospatial and visuoperceptural
deficits, with patients often having features of simultanagnosia
(inability to perceive more than a single object at one time),
optic ataxia, oculomotor apraxia (a defect of controlled,
voluntary, and purposeful eye movement), and dysgraphia
(inability to write coherently) [101].
In DLB, MR will show variable white matter
hyperintensity and cortical atrophy, with sparing of the
hippocampi [106].
Frontotemporal dementia (Pick's Disease):
Frontotemporal dementia (FTD) is another cortical dementia which
is less common than Alzheimers disease [8,21]. Although it is the
third most common type of dementia, it is estimated to account for
less than 10% of all dementia cases [93, 106]. The age of onset is
typically younger than for AD, generally before age 60-65 years
(FTD is the most common type of dementia in patients younger than
60 years of age [93]) [82,106]. FTD is a heterogenenous group of
neurodegenerative conditions that share certain clinical features
caused by progressive degeneration of the frontal and anterior
temporal lobes [8,21,35,82]. FTD usually presents with changes in
personality, language, and behavior (social impairment and
disinhibitive and impulsive behavior), with memory dysfunction not
occurring until later [8,27,75]. Cognitive disturbances typical of
FTD include attention deficits and impaired executive function
[54]. FTD subtypes include behavioral FTD and language-predominant
cognitive decline FTD, the later of which is referred to as
primary progressive aphasia (PPA) [93]. PPA is further classified
into semantic, agrammatic, or nonfluent, and logopenic PPA
variants [93].
At autopsy, there is frontal and temporal atrophy with neuronal
loss, gliosis, inflated neurons, and Pick bodies [8].
Neuropathologic findings include the presence or absence of τ-protein, ubiquitin, and the predominant
τ-isoform, as detected by immunohistochemistry [54]. Most
patients with FTD show brain pathology with ubiquitin positive
inclusions, whereas some FTD patients show τ-positive inclusions
[54]. Familial FTD is common, and genetic mutations have been
demonstrated on chromosome 17 in the τ or progranulin genes
[54]. There are presently no approved pharmacologic
interventions for FTD and the use of anticholinesterase-type
medications should be avoided [75]. Symptomatic therapies, such
as cholinesterase inhibitors (donepezil)
that are effective in AD,
do not have proven efficacy in FTD [85,93]. In fact, donepezil
may even decrease the quality of life in patients with FTD
[93].
On FDG PET imaging, hypometabolism in the frontal and anterior
temporal lobes is the characteristic finding [21,75,93]. Other
areas that may be involved include the anterior cingulate gyrus,
uncus, insula, basal ganglia, and thalamic regions [35]. The
hypometabolism is frequently asymmetric and worse on the left
[21]. FDG PET can discriminate FTD from AD with more than 85%
sensitivity and specificity [54]. Amyloid PET is expected to be
negative in FTD, but a significant minority of patients (up to 25%
[84]) can have positive scans (differing depending on the subtype
of FTD and this could be related to comorbid AD) [82]. For
semantic PPA, FDG imaging demonstrates a pattern of asymmetric
(left greater than right) anterior temporal hypometabolism with
extension into the frontoparietal cortex later in the disease
process [93]. Agrammatic or nonfluent PPA typically shows
hypometabolism specially involving the middle and inferior aspect
if the left frontal lobe and precentral gyrus [93]. With logopenic
PPA, there is commonly left lateral temporal-parietal lobe and
left middle parietal hypometabolism [93].
Amyloid imaging should be negative in patients with FTD [93]. False positive Florbetapir imaging has been reported in up to 25% of FTD patients [85]. This may be in part related to prominent cortical atrophy which can make distinction between white and gray matter activity difficult [85]. Also- some patients with FTD and the APOE E4 allele (homozygous) can have elevated florbetapir uptake due to extensive neuritic plaque deposition [85].
In patients with behavioral FTD, MR imaging will demonstrate
symmetric or assymetric frontal and anterior temporal atrophy,
which can be severe, resulting in a knife-blade-gyri appearance
(although this is a late finding) [82,93]. There is relative
sparing of the parietal and occipital lobes [93]. FOr patients
with language-predominant cognitive decline PPA subtypes, the
following patterns of atrophy have been described: Semantic PPA-
left anterior temporal lobe and hippocampal atrophy; Agrammatic or
nonfluent PPA- left perisylvian cortex, inferior frontal gyrus
(Broca area), abd superior temporal gyrus atrophy; and logioenic
PPA- left posterior sylvian or parietal atrophy [93].
Parkinson's is a neurodegenerative disorder resulting from the
progressive death of dopaminergic neurons in the nigrostriatal
pathway (pars compacta of the substantia nigra and locus ceruleus,
and presynaptic dopaminergic nerve terminals in the caudate
nucleus and putamen) [8,12]. Although the cause of the disease is
unknown, the disease is associated with a gradual accumulation of
the misfolded synaptic protein α-synuclein in the nervous system
[96]. Symptoms consist of rigidity, bradykinesia, difficulty in
initiating and stopping movement, and a resting tremor [8]. A
clear response to dopaminergic therapy and the presence of either
olfactory loss or cardiac sympathetic denervation are supportive
clinical findings [103]. The clinical symptoms of PD have been
reported to be induced after 40-50% loss of the neurons in the
substantia nigra pars compacta; there was also a reduction of
dopamine to about 20% of normal levels in the striatum.
Parkinson's disease can be genetic and certain genes are associated with autosomal recessive Parkinson's [98]. PARK2 is the most common - accounting for 50% of familial cases and 15% of sporadic cases with onset before 45 years [98]. The PARK2 clinical phenotype is characterized by symmetrical onset, slow progression, good and sustained response to L-DOPA, and occurrence of dyskinesias in an early stage of the disease [98]. Other features include dystonic signs at onset, hypereflexia, peripheral neuopathy, and preserved olfactory function [98]. Most patients with PARK2 have neuronal loss in the substantia nigra more than in the locus coeruleus [98]. These patients have also been shown to demonstrate preserved myocardial 123I-MIBG activity, as opposed to decreased uptake and higher washout rates identified in patients with idiopathic Parkinson's disease [98].
The loss of nigrostriatal dopaminergic projection neurons of the substantia nigra pars compacta is primarily responsible for the development of typical motor symptoms [103]. Motor disturbances, however, begin only after a loss of approximately 70-80% of striatal dopamine- thus, there is a long latent period which precedes the development of clinical symptoms [12]. (Other authors indicate that symptoms are induced after 40-50% loss of the neurons in the substantia nigra pars compacta [91].) Cognitive dysfunction occurs in 25-30% of patients with Parkinson disease and this prevalence is 6 times greater than the general population [42]. Approximately 10% of patients with Parkinson's develop a dementia [8], although other authors indicate a prevalence of around 40% [54]. The key feature of dementia in Parkinson disease is executive dysfunction- i.e.: difficulty with tasks that require generation of mental sets, planning, and cognitive sequencing [42]. There is impairment in short-term recall, attention, and visuospatial functions [54]. In addition to manifesting cognitive impairment, PD patients can manifest personality and behavioral changes along with fluctuating confusion and visual hallucinosis [54].
Cognitive impairment is frequent in PD, with up to 80% of all
patients developing dementia [103]. The dementia associated with
Parkinson's seems to produce a uniform cerebral hypometabloism,
however, biparietal hypometabolism identical to Alzheimer's can
also seen in these patients (this finding is typically not found
in Parkinson's patients without dementia) [8,27].
PET imaging in Parkinson:
6-[18F] fluoro-DOPA:
L-dihydroxyphenylalanine (L-DOPA) is the immediate precursor of dopamine [36]. L-DOPA is carried into the brain by the large neutral amino acid transport system, converted into dopamine by the action of L-aromatic amino acid decarboxylse, and then stored in intraneuronal vesicles [36]. The loss of dopaminergic nerve terminals in the basal ganglia can be detected by PET imaging with 6-[18F] fluoro-DOPA (an analog of L-DOPA]) to study the presynaptic component of the nigrostriatal dopamine system and dopamine metabolism [36]. The agent crosses the blood brain barrier where it is converted into 6-[18F]-fluoro-dopamine by the action of DOPA decarboxylase and stored in the presynaptic vesicles [23,38]. Unfortunately, 6-FD is also largely metabolized peripherally by DOPA decarboxylase (DDC) to 3-O-6 -[18F]-fluorodopamine which also crosses the BBB [23]. This factor, as well as other peripheral metabolites which may cross the BBB, complicate the quantification of brain uptake of 6-FD. Pre-treatment with inhibitors of DDC, such as Carbidopa, when injected before administration of the 6-FD improve brain uptake of the tracer considerably [22]. One other problem with [18F] fluoro-DOPA imaging is that the decardoxylating enzyme can be upregulated as a compensatory phenomenon, and the uptake of 18F-DOPA may be normal in patients with early disease [36,38]. Neurogenic orthostatic hypotension and severe supine hypertension can also result in higher concentrations of tracer in the putamen [50]
The cerebral radioactivity measured after the administration of
6-FD is a function of uptake of the isotope into the brain and its
subsequent metabolism to dopamine. In Parkinson's disease,
decreased 6-FD uptake in the striatum has been reported with the
decrease in 6-FD accumulation being much more severe in the
putamen than in the caudate nucleus [24,46]. Additionally, the
decreased uptake is most prominent in the caudal parts of the
putamen because of the topographic organization of the
nigrostriatal projection [46]. Patients in the early stage of PD
have at least a 30% loss of 6-FD uptake in the putamen
contralateral to the side with predominant clinical symptoms
[46]. Parkinson's patients with early disease and a continued
response to L-dopa therapy retain 6-FD in the striatum better than
patients with long-standing disease and a fluctuating response to
therapy [30]. 6-FD imaging can also be used to monitor response to
therapy and disease progression [30].
18F-FDG:
On FDG, a Parkinson disease related pattern of metabolism has
been described and is characterized by relatively increased
metabolism in the globus pallidus and putamen, thalamus,
cerebellum, pons, and sensori-motor cortex and relative decreased
metabolism in the posterior temporoparitetal occipital areas and
sometimes lateral frontal area (especially in PD with cognitive
impairment) [96,103].
A separate temor-related pattern in Parkinson disease has also
been described and is characterized primarily by increases in the
cerebellum and primary motor cortex [96].
Other 18F agents:
F-18 labeled derivatives of m-tyrosine have also been used to
study Parkinson's disease. m-Tyrosine is a substrate for the
enzyme aromatic amino acid decarboxylase which is responsible for
the conversion of DOPA to dopamine. Marked reduction in activity
within the basal ganglia (putamen and caudate) is seen in patients
with Parkinson's disease with both 6-FD and m-tyrosine.
Other agents:
11C-raclopride is a D2 receptor agonist that has been used to detect signs of nigrostriatal degeneration [54]. An increase in D2 receptor binding was observed in patients with early PD, and a reduction in binding has been observed after levodopa treatment [54]. However, PET studies of alterations in D2 dopamine receptors have been conflicting. Patients that have been studied with C-11 N-methylspiperone, while maintained on their usual dose of L-DOPA, display essentially normal levels of dopamine receptors, despite the fact that F-18 fluoro-DOPA uptake is markedly reduced.
C-11 Nomifensine has been developed to study the dopamine
reuptake system located on the presynaptic nerve terminals. This
agent also demonstrates decreased uptake within the basal ganglia
of Parkinson's patients.
Drug-induced Parkinson (DIP):
DIP may develop in individuals treated with dopamine
receptor-blocking agents, such as neuroleptics and antiemetics,
dopamine depleters, and calcium channel blockers [90]. DIP
symptoms usually disappear within 2 months of discontinuation of
the fofending drug [90]. DAT imaging is normal in patients with
DIP because the condition occurs in the absence of presynaptic
dopaminergic deficits [90].
Huntington's disease is a slowly progressive autosomal dominant
neurodegenerative disorder characterized by choreiform
(involuntary) movements, personality disorders, psychiatric
symptoms, and dementia [8]. Approximately 10-15% of cases are
sporadic [94]. There is cytosine-adenosine-guanine trinucleotide
repeats in the short arm of chromosome 4 [94]. There are both
adult (more common - 90-95% of cases) and juvenile onset forms
[94]. The age of onset is variable, but it occurs most frequently
in the 3rd and 4th decades of life (40-50 years) [8,94].
On anatomic imaging, there is severe neuronal loss and atrophy of the caudate nuclei, and to a lesser extent the putamen and globus pallidus [8]. The caudate and putamen are deficient in the inhibitory neurotransmitter gamma aminobutyric acid (GABA) and glutamic acid decarboxylase.
FDG PET studies demonstrate decreased metabolic activity in the
caudate, even when the CT is normal and years before the onset of
motor symptoms [8,13]. Unfortunately, there is overlap of local
caudate metabolic rates in patients at risk for Huntington's and
normal control populations [13]. Other authors describe
hypometabolism in the frontal and temporal lobes and more severe
deficits in the basal ganglia [94]. Global CMRglu tends to be
normal in Huntington's patients, in contrast to Alzheimer's
patients in which it is decreased.No cerebral amyloid deposition
is seen [94].
Normal Pressure Hydrocephalus:
Clinically patients present with dementia, a gait disturbance, and urinary incontinence. ("Wet, wacky, and wobbly".) CT demonstrates moderate to severe enlargement of the frontal horns, obliteration of the sulci over the convexities, and periventricular hypodensities. The CSF pressure is normal. PET studies have demonstrated decreased metabolic activity compared to normal controls, but no regional deficit has been identified.
Progressive supranuclear palsy (Steele-Richardson-Olszewski syndrome):
PSP begins in the 6th or 7th decade of life, and the duration of
illness can range from 2 to 12 years [8]. PSP is characterized by
parkinsonism with bradykinesia and rigidity, postural instability,
and a pseudobulbar palsy syndrome with dysarthria and dysphagia,
and frontal type dementia [8,30,78]. A clinical hallmark of the
disorder is oculomotor dysfunction with paralysis of vertical
gaze, particularly in the downward direction (supranuclear palsy
of vertical gaze), although this may be absent at disease onset
[8,78,82]. In contrast to Parkinson disease, PSP manifests as a
symmetric rather than asymmetric-rigid syndrome [78]. PSP also
initially targets the trunk and neck, rather than the limbs,
causing early postural and gait instability with falls
[78,93].Concomitant cognitive impairment is typically
characterized by personality change, memory impairment, and
depression or apathy [94]. Disease progression is usually
aggressive, with death within 6-10 years of diagnosis [94].
Gross anatomic changes which can be seen on MR include: first
atrophy of the midbrain tegmentum with relative sparing of the
pons producing a "hummingbird" apperance to the brainstem on
midline sagittal images (seen in 67% of patients with
pathologically proven PSP [112]); second, atrophy of the midbrain,
preservation of the tectum, and widening of the interpeduncular
cistern which produces the "Mickey Mouse" sign on axial images;
and putaminal T2 hypointensity which is likely caused by iron
deposition [8,82,94]. Atrophy of the dentate nuclei of the
cerebellum and the cerebellar hemispheres may also be seen to some
degree [8,82]. Superior cerebellar peduncle atrophy is also
characteristic of the disorder [82]. There is an increase in
aqueductal size, as well as in the size of the quadrigeminal,
ambient, and crural cisterns [8]. Atrophy and abnormal FLAIR
signal intensity of the cerebellar peduncles can also be seen
[94].
Classically the condition produces a pattern of global reductions
in cerebral oxygen and glucose metabolism that are most prominent
in the frontal cortex [3,8]. FDG PET reveals decreased glucose
metabolism in the medial, dorsal, and ventrolateral frontal areas
(the anterior cingulate gyrus, supplementary motor area,
precentral gyrus, and pre-motor to posterior pre-frontal areas),
as well as the caudate, thalamus, and upper brain stem
[78,82,103]. The clinical symptoms have been linked to predominant
bilateral regional hypometabolism with vertical gaze palsy
associated with hypometabolism in the anterior cingulate gyrus,
repeated unprovoked falls to the thalamus, gait freezing to the
midbrain, and nonfluent aphasia with left medial and dorsolateral
frontal lobe hypometabolism [103].
There is no cortical deposition of amyloid on amyloid PET imaging
[78]. 123I-ioflupane demonstrates reduced striatal
dopaminergic activity with variable patterns that may be symmetric
or asymmetric and may affect the putamen or caudate nucleus [78].
Corticobasal degeneration:
Corticobasal degneration is often associated with a clinical
constellation of findings termed corticobasal syndrome which
includes asymmetric Parkinsonism (limb rigidity or akinesia), limb
distonia or myoclonus, oro-buccal or limb apraxia, gait
disturbance, cortical sensory deficit, and alien hand phenomena
[82,103]. The condition can be seen with other FTD-associated
diseases, as well as AD [82]. The clinical diagnosis of CBD is
accurate in only about 25-50% of patients [103].
There is asymmetric frontal atrophy involving the the paracentral
and parasagittal structures [82]. FDG imaging shows highly
asymmetric, often unilateral, hypometabolism contralateral to
predominant motor symptoms, involving the
frontoparietal/parietotemporal cortex, sensorimotor cortex,
prefontal cortex, caudate, and thalamus [82,103].
Multiple system atrophy
Multiple system atrophy (MSA) is a primary oligodendroglial
α-synucleinopathy with consecutive neuronal degeneration [103].
MSA pathology most severly affects the substantia nigra, caudate,
putamen, cerebellar white matter, pontine nuclei, inferior olivary
nucleus, and medullary tegmentum [103].
On FDG imaging, MSA patients show a marked hypometabolism of the
posterior putamen, pons, and cerebellum, depending on the
predominant side of degeneration [103].
Creutzfeldt-Jakob disease:
CJD is a rare fatal prion neurodegenerative disease characterized by rapidly progressive dementia with myoclonus [94]. The characteristic EEG finding is periodic complexes [94]. The most common imaging finding on MR is rapidly progressive atrophy that typically involves the frontal, temporal, and parietal lobes [94]. There is T2 signal and diffusion restriction in the pulvinar of the thalami and symmetric increased signal intensity in the pulvinar and dorsomedial thalamus that produces a "hockey stick" configuration [94]. Other findings include patchy gyriform T2 hyperintensity in the cerebral cortex and increased T1 signal in the globus pallidum [94]. A classic appearance of CJD has not been described on FDG imaging [94]. No amyloid deposition should be identified [94].
PET imaging findings in Dementias [20]
| Dementia | PET findings |
| Alzheimer's | Decreased activity in the bilateral temporal and parietal cortices. During early stages, the defects often appear asymmetric. There is relative sparing of the basal ganglia, thalamus, cerebellum, and cortex mediating primary motor and sensory functions. |
| Vascular | Scattered defects in the cortical, subcortical, and cerebellar areas |
| Frontotemporal (Pick's) | Frontal cortex and anterior temporal and mesiotemporal decreased activity with sparing of the sensorimotor and visual cortices |
| Huntington's | Decreased activity in the caudate and lentiform nuclei (early) with gradual development of diffuse cortical involvement |
| Parkinson's with dementia | Deficits are similar to those of AD, but with more sparing of the mesiotemporal area and less sparing of the visual cortex |
| Dementia with Lewy bodies | Deficits are similar to AD, but with less sparing of the occipital cortex and possibly cerebellum |
Psychiatric disorders:
Schizophrenia
Schizophrenia represents a heterogeneous disorder characterized by phychosis with hallucinations and delusions [9,52]. Studies have suggested an association with activated microglial cells and inflammaiton in the brain- microglial cells are the predominant population of macrophages in the brain and they are responsive to injury or infection in brain tissue [52].
The most frequently reported finding in patients with schizophrenia is decreased metabolic activity and decreased CBF in the frontal cortex- referred to as hypofrontality [9]. This finding is predominantly seen in patients with chronic schizophrenia that have a long history of neuroleptic treatment [9]. Studies have shown that chronic neuroleptic treatment increases whole brain metabolism, but this increase is less in the frontal lobes than other areas [9]. In contrast, younger patients may not demonstrate hypofrontality [9]. Hypofrontality is also more commonly identified in paranoid (45%), than non-paranoid schizophrenics (20%).
When challenged with an activation task such as the Wisconsin Card Sorting Test, most patients with schizophrenia demonstrate a failure of frontal lobe activation which is felt to be related to decreased dopamine function [9]. Because the frontal cortex is highly interconnected, an abnormality in this location may produce disturbances of activity in other cortical and subcortical structures. Unfortunately, frontal metabolic defects are not specific for schizophrenia and have also been identified in patients with affective disorders, chronic cocaine abuse, Parkinson's disease, supranuclear palsy, and advanced age [9].
Several tracers have also been used to measure dopamine receptors in schizophrenic patients and patients with Parkinson's disease: 18-F or 11-C N-methylspiroperidol (NMS), 11-C raclopride, F-18 spiperone, and Bromine-76 bromospirone. N-methylspiroperidol (NMS) is a potent antipsychotic drug that is pharmacologically similar to haloperidol. It binds to both dopamine D2 and serotonin S2 receptors (however, its binding affinity for Serotonin receptors is much lower than for the D2 receptors). D2 receptors exist on axons passing from the substantia nigra to the basal ganglia, while D1 receptors are found on axons passing from the cerebral cortex to these structures.
Following administration of NMS there is preferential accumulation of the tracer in the caudate nucleus and putamen which contain the highest densities of dopamine receptors (the corpus striatum is the site of greatest concentration of dopamine receptors in normal patients). Thalamic and cerebellar activity is low. C-11 raclopride is more sensitive to changes in dopamine concentration as it binds D2 receptors more selectively and has negligible binding to serotonin receptors. The agent can be used to monitor relative changes in synaptic dopamine concentration.
An increased number of D2 receptors in the caudate and putamen can be found in patients with untreated schizophrenia, however, patients with decreased dopamine D2 receptor concentrations have also been described. Because neuroleptics bind to dopamine receptors, the amount of available dopamine receptors demonstrated on PET imaging will reflect the amount of bound ligand (ie: NMS activity will decrease as greater amounts of the neuroleptic agent is bound). Patients receiving adequate treatment with neuroleptic drugs have approximately 90% of their dopamine receptors occupied (implying a near total blockage of dopaminergic neurotransmission). It was hoped that PET imaging could be used to identify patients that might not respond to neuroleptic therapy. Unfortunately studies have not been able to demonstrate a difference in receptor blockade between responders and non-responders [9].
The lack of consistent PET findings in patients with schizophrenia would suggest that schizophrenia is a heterogeneous disorder with subgroups of patients with different cerebral abnormalities.
Substance Abuse:
11-C labeled cocaine shows a heterogeneous distribution within the brain, with maximal uptake in the basal ganglia. Studies have also demonstrated that cocaine produces decreased metabolism in the cortical and subcortical structures [9], as well as widespread abnormalities in cerebral blood flow [9]. These flow abnormalities are probably the result of cocaine induced vasoconstriction, which can lead to tissue ischemia and infarction if severe [9]. The perfusion abnormalities are mostly localized to the frontal cortex, and cerebellar flow is generally unimpaired.
The region most commonly reported to be abnormal in metabolic studies of alcoholics is the frontal cortex [9]. Other studies during alcohol intoxication have demonstrated more heterogeneous decreases in metabolism, with the areas greatest affected being the occipital cortex, the cerebellum, and the prefrontal cortex- these areas also contain the highest concentration of benzodiazepine receptors in the brain [9]. Other areas which have relatively low concentrations of these receptors, such as the basal ganglia and corpus callosum, demonstrate only minimal metabolic changes following alcohol consumption.
C-11 Carfentanyl has a high affinity for mu opiate receptors which mediate analgesia and respiratory depression. The highest concentration of opiate receptors exist in the thalamus (highest concentration of mu receptors), striatum (caudate nucleus), and amygdala. There are very low concentrations of opiate receptors in the motor-sensory and occipital cortex. The distribution of the tracer can be changed by the prior administration of naloxone (an opiate antagonist) which results in markedly decreased uptake of the agent. C-11 carfentanyl studies of patients with partial complex seizures have demonstrated increased opiate receptor binding in the temporal lobe containing the epileptic focus (corresponding to the area of decreased glucose utilization identified on FDG imaging).
REFERENCES:
(1) J Nucl Med 2001; Meltzer CC, et al. Does cerebral blood flow decline in healthy aging? A PET study with partial-volume correction. 41: 1842-1848
(2) J Nucl Med 2001; Fazio F, Perani D. Importance of partial-volume correction in brain PET studies. 41: 1849-1850 (No abstract available)
(3) J Nucl Med 2001; Hoffman JM, et al. FDG PET imaging in patients with pathologically verified dementia. 41: 1920-28
(4) J Nucl Med 2001; Silverman DHS, Phelps ME. Evaluating dementia using PET: How do we put into clinical perspective what we know to date? 41: 1929-32 (No abstract available)
(5) J Nucl Med 1993; Henry T, et al. Clinical evaluation of interictal fluoring-18-fluorodeoxyglucose PET in partial epilepsy. 34: 1892-1898
(6) J Nucl Med 2001; O'Brien TJ, et al. The utility of a 3-dimensional, large field-of-view, sodium iodide crystal-based PET scanner in the presurgical evaluation of partial epilepsy. 42: 1158-1165
(7) J Nucl Med 2001; Derdeyn CP, et al. Comparison of PET oxygen extraction fraction methods for the prediction of stroke risk. 42: 1195-1197
(8) Semin Nucl Med 1992; Mazziotta JC, et al. The use of positron emission tomography in the clinical assessment of dementia. 22: 233-246
(9) Semin Nucl Med 1992; Volkow ND, Fowler JS. Neuropsychiatric disorders: Investigation of schizophrenia and substance abuse. 22: 254-267
(10) Semin Nucl Med 1992; Broich K, et al. Positron emission tomography in cerebral vascular disorders. 22: 224-232
(11) Semin Nucl Med 1992; Chungani HT. The use of positron emission tomography in the clinical assessment of epilepsy. 22: 247-252
(12) J Nucl Med 2001; Huang WS, et al. Evaluation of early-stage Parkinson's disease with 99mTc-TRODAT-1 imaging. 42: 1303-1308
(13) J Nucl Med 2001; Feigin A, et al. Metabolic network abnormalities in early Huntington's disease: an [18F]FDG PET study. 42: 1591-1595
(14) J Nucl Med 2001; Herholz K, et al. Direct comparison of spatially normalized PET and SPECT scans in Alzheimer's disease. 43: 21-26
(15) J Nucl Med 2002; Silverman DH, et al. Evaluating early dementia with and without assessment of regional cerebral metabolism by PET: A comparison of predicted costs and benefits. 43: 253-266
(16) Radiology 2003; Petrella JR, et al. Neuroimaging and early diagnosis of Alzheimer disease: a look to the future. 226: 315-336
(17) JAMA 2001; Silverman DH, et al. Positron emission tomography in evaluation of dementia. 286: 2120-2127
(18) AJR 2004; Norfray JF, Provenzale JM. Alzheimer's disease: neuropathologic findings and recent advances in imaging. 182: 3-13
(19) Radiology 2004; Patwardhan MB, et al. Alzheimer disease: operating characteristics of PET- a meta-analysis. 231: 73-80
(20) J Nucl Med 2004; Silverman DH. Brain 18F-FDG PET in the diagnosis of neurodegenerative dementias: comparison with perfusion SPECT and with clinical evaluations lacking nuclear imaging. 45: 594-607
(21) J Nucl Med 2005; Jeong Y, et al. 18F-FDG PET findings in frontotemporal dementia: an SPM analysis of 29 patients. 46: 233-239
(22) Seminars in Nuclear Medicine 1994, p.339
(23) Radiol Clin N Am 2004; Shiue CY, Welch MJ. Update on PET radiopharmaceuticals: life beyond flurodeoxyglucose. 42: 1033-1053
(24) Seminars in Nuclear Medicine, Oct. 1994, p.339
(25) J Nucl Med 2005; Drzezga A, et al. Prediction of individual clinical outcome in MCI by means of genetic assessment and 18F-FDG PET. 46: 1625-1632
(26) J Nucl Med 2005; CHen WP, et al. Rapid scanning protocol for brain 18F-FDG PET: a validation study. 46:1633-1641
(27) Radiol Clin N Am 2005; Newberg AB, Alavi A. The role of PET imaging in the management of patients with central nervous system disorders. 43: 49-65
(28) Radiol Clin N Am 2005; Silverman DHS, Alavi A. PET imaging in the assessment of normal and impaired cognitive function. 42: 67-77
(29) Radiol Clin N Am 2005; Newberg AH, Alavi A. PET in seizure disorders. 43: 79-92
(30) Radiol Clin N Am 2005; Fischman AJ. Role of [18F]-dopa-PET imaging in assessing movement disorders. 43: 93-106
(31) J Nucl Med 2006; Kobayashi M, et al. Diagnosis of misery perfusion using noninvasive 15O-gas PET. 47: 1581-1586
(32) J Nucl Med 2006; Mosconi L, et al. Hypometabolism exceeds atrophy in presymptomatic early-onset familial Alzheimer's disease. 47: 1778-1786
(33) J Nucl Med 2007; Ishii K, et al. Comparison of regional brain volume and glucose metabolism between patients with mild dementia with Lewy bodies and those with mild Alzheimer's disease. 48: 704-711
(34) J Nucl Med 2007; Lin TW, et al. Predicting seizure-free status for temporal lobe epilepsy patients undergoing surgery: prognostic value of quantifying maximal metabolic asymmetry extending over a specified proportion of the temporal lobe. 48: 776-782
(35) J Nucl Med 2007; Matsuda H. ROle of neuroimaging in Alzheimer's disease, with emphysis on brain perfusion SPECT. 48: 1289-1300
(36) J Nucl Med 2007; Nanni C, et al. 18F-DOPA PET and PET/CT. 48: 1577-1579
(37) J Nucl Med 2007; Inui Y, et al. Evaluation of probable or possible dementia with Lewy bodies using 123I-IMP brain perfusion SPECT, 123I-MIBG, and 99mTc-MIBI myocardial SPECT. 48: 1641-1650
(38) Radiology 2007; Hammoud DA, et al. Molecular neuroimaging: from conventional to emerging technologies. 245: 21-42
(39) J Nucl Med 2007; Matsunari I, et al. Comparison of 18F-FDG PET and optimized voxel-based morphology for detection of Alzheimer's disease: aging effect on diagnostic performance. 48: 1961-1970
(40) J Nucl Med 2008; Mosconi L, et al. Multicenter standardized 18F-FDG PET diagnosis of mild cognitive impairment, Alheimer's disease, and other dementias. 49: 390-398
(41) J Nucl Med 2008; O'Brien TJ, et al. The cost-effective use of 18F-FDG PET in presurgical evaluation of medically refractory focal epilepsy. 49: 931-937
(42) J Nucl Med 2008; Lee PH, et al. Changes in cerebral glucose metabolism in patients with Parkinson disease with dementia after cholinesterase inhibitor therapy. 49: 2006-2011
(43) J Nucl Med 2009; Tolboom N, et al. Detection of Alzheimer pathology in vivo using both 11C-PIB and 18F-FDDNP PET. 50: 191-197
(44) J Nucl Med 2009; O'Keefe GJ, et al. Radiation dosimetry of beta-amyloid tracers 11C-PIB and 18F-BAY94-9172. 50: 309-315
(45) J Nucl Med 2009; McNamee RL, et al. Consideration of optimal time window for Pittsburg compound B PET summed uptake measurements. 50: 348-355
(46) J Nucl Med 2009; Jokinen P, et al. Simple ratio analysis of 18F-fluorodopa uptake in striatal subregions separates patients with early Parkinson disease from healthy controls. 50: 893-899
(47) J Nucl Med 2009; Nelissen N, et al. Phase 1 study of the Pittsburgh compound B derivative 18F-flutemetamol in healthy volunteers and patients with probable Alzheimer disease. 50: 1251-1259
(48) J Nucl Med 2009; Mitsis EM, et al. 123I-5-IA-85380 SPECT imaging of nicotinic receptors in Alzheimer disease and mild cognitive impairment. 50: 1455-1463
(49) J Nucl Med 2009; Tolboom N, et al. Relationship of cerebrospinal fluid markers to 11C-PIB and 18F-FDDNP binding. 50: 1464-1470
(50) J Nucl Med 2009; Goldstein DS, et al. Hypertension increases cerebral 6-18F-fluorodopa-derived radioactivity. 50: 1479-1482
(51) J Nucl Med 2009; Lim SM, et al. The 18F-FDG PET cingulate island sign and comparison to 123I-β-CIT SPECT for diagnosis of dementia with Lewy bodies. 50: 1638-1645
(52) J Nucl Med 2009; Doorduin J, et al. Neuroinflammation in schizophrenia-related psychosis: a PET study. 50: 1801-1807
(53) AJR 2009; Nagar VA, et al. Reperfusion phenomenon masking acute and subacute infarcts at dynamic perfusion CT: confirmation by fusion of CT and diffusion-weighted MR images. 193: 1629-1638
(54) J Nucl med 2010; Kadir A, Nordberg A. Target-specific PET probes for neurodegenerative disorders related to dementia. 51: 1418-1430
(55) J Nucl Med 2010; Kumar A, et al. Objective detection of epileptic foci by 18F-FDG PET in children undergoing epilepsy surgery. 51: 1901-1907
(56) J Nucl Med 2011; Rostomian AH, et al. Early 11C-PIB frames and 18F-FDG PET measures are comparable: a study validated in a cohort of AD and FTLD patients. 52: 173-179
(57) Radiology 2011; Bizzi A. Longitudinal MR imaging in Alzheimer disease: a study anyone can join. 258: 657-659
(58) J Nucl Med 2011; Meyer PT, et al. Dual-biomarker imaging of regional cerebral amyloid load and neuronal activity in dementia with PET and 11C-labeled Pittsburg compound B. 52: 393-400
(59) JAMA 2011; Clark CM, et al. Use of Florbetapir-PET for
imaging β-amyloid pathology.
305: 275-283
(60) J Nucl Med 2011; Villemagne VL, et al. Amyloid imaging with
18F-florbetaben in Alzheimer disease and other
dementias. 52: 1210-1217
(61) J Nucl Med 2011; Rowe CC, Villemagne VL. Brain amyloid
imaging. 52: 1733-1740
(62) Ann Neurol 2010; Vandenberghe R, et al. 18F-flutemetamol
amyloid
imaging
in
Alzheimer
disease
and
mild
cognitive
impairment:
a phase 2 trial. 68: 319-329
(63) J Nucl Med 2012; Bohnen NI, et al. Effectiveness and safety
of 18F-FDG PET in the evaluaiton of dementia: a review
of the recent literature. 53: 59-71
(64) J Nucl Med 2012; Joshi AD, et al. Performance
characteristics of amyloid PET with florbetapir F18 in patients
with Alzheimer's disease and congnitively normal subjects. 53:
378-384
(65) Radiology 2012; Jack CR. Alzheimer disease: new concepts on
its neurobiology and the clinical role imaging will play. 263:
344-361
(66) J Nucl Med 2012; Newberg AB, et al. Initial clinical
comparison of 18F-florbetapir and 18F-PET
in patients with Alzheimer disease and controls. 53: 902-907
(67) Radiology 2013; Shaffer JL, et al. Predicting congnitive
decline in subjects at risk for Alzheimer disease by using
combined cerebrospinal fluid, MR imaging, and PET biomarkers. 266:
583-591
(68) J Nucl Med 2013; Johnson KS, et al. Appropriate use criteria
for amyloid PET: a report of the amyloid imaging task force, the
Society of Nuclear Medicine and Molecular Imaging, and the
Alzheimer's association. 54: 476-490
(69) J Nucl Med 2013; Albin R, et al. Assessing mild cognitive
impairment with amyloid and dopamine termianl molecular imaging.
54: 887-893
(70) J Nucl Med 2013; Johnson KA, et al. Update on appropriate
use criteria for amyloid PET imaging: dementia experts, mild
cognitive impairment, and education. 54: 1011-1013
(71) Radiographics 2013; Stanescu L, et al. FDG PET of the brain
in pediatric patients: imaging spectrum with MR imaging
correlation. 33: 1279-1303
(72) J Nucl Med 2013; Kumar A, Chugani HT. The role of
radionuclide imaging in epilepsy, part 1: sporadic temporal and
extratemproal lobe epilepsy. 54: 1775-1781
(73) Radiology 2013; Petrella JR. Neuroimaging and the search for
a cure for Alzheimer disease. 269: 671-691
(74) J Nucl Med 2014; Roberts RO, et al. Diabetes and elevated
hemoglobulin A1c levels are associated with brain hypometabolism
but not amyloid accumulation. 55: 759-764
(75) Radiographics 2014; Brown RK, et al. Brain PET in suspected
dementia: patterns of altered FDG metabolism. 34: 684-701
(76) J Nucl Med 2014; Hitz S, et al. Systematic comparison of the
performance of integrated whole-body PET/MR imaging to
conventional PET/CT for 18F-FDG brain imaging in
patients examined for suspected dementia. 55: 923-931
(77) J Nucl Med 2014; Mach RH. New targets for the development of
PET tracers for imaging neurodegeneration in Alzheimer disease.
55: 1221-1224
(78) Radiographics 2014; Broski SM, et al. Structural and
functional imaging in Parkinsonian syndromes. 34: 1273-1292
(79) J Nucl Med 2014; Thurfjell L, et al. Automated
quantification of 18F-fluremetamol PET activity for
categorizing scans as negative or positive for brain amyloid:
concordance with visual image reads. 55: 1623-1628
(80) J Nucl Med 2014; Heiss WD. Radionuclide imaging in ischemic
stroke. 55: 1831-1841
(81) J Nucl Med 2014; O'Brien JT, et al. 18F-FDG PET
and perfusion SPECT in the diagnosis of Alzheimer and Lewy Body
dementias. 55: 195901965
(82) J Nucl Med 2014; Nasrallah IM, Wolk DA. Multimodality
imaging of Alzheimer disease and other neurodegenerative
dementias. 55: 2003-2011
(83) J Nucl Med 2015; Ishibashi K, et al. Relationship between Alzheimer disease-like pattern of 18F-FDG and fasting plasma glucose levels in cognitively normal volunteers. 56: 229-233
(84) J Nucl Med 2015; Frey KA. Amyloid imaging in dementia:
contribution or confusion? 56: 331-332
(85) J Nucl Med 2015; mKobylecki C, et al.
18F-florbetapir PET in
patients with frontotemporal dementia and Alzheimer disease. 56:
386-391
(86) J Nucl Med 2015; Landau SM, et al.
Measurement of longitudinal beta-amyloid change with 18F-Florbetapir PET and standardized
uptake value ratios. 56: 567-574
(87) JAMA 2015; Ossenkoppele R, et al.
Prevalence of amyloid positivity in dementia syndromes a
meta-analysis. 313: 1939-1949
(88) J Nucl Med 2016; Rullmann M, et al.
Partial-volume effect correction improves quantitative analysis
of
18F-florbetaben beta-amyloid PET
scans. 57: 198-203
(89) J Nucl Med 2016; Grimmer T, et al.
Visual versus fully automated analyses of 18F-FDG and amyloid PET for prediction
of dementia due to Alzheimer disease in mild cognitive
impairment.57: 204-207
(90) Radiology 2016; Sung YH, et al.
Drug-induced Parkinsonism versus idiopathic Parkinson disease:
utility of Nigrosome 1 with 3-T imaging. 279: 849-858
(91) J Nucl Med 2016; Tsukada H, et al. PET
imaging of mitochondrial complex I with 18F-BCPP-EF in the brains of
MPTP-treated monkeys. 57: 950-953
(92) J Nucl Med 2016; Minoshima S, et al.
SNMMI procedure standard/EANM practice guideline for amyloid PET
imaging of the brain 1.0. 57: 1316-1322
(93) AJR 2016; Martin-Macintosh EL, et al.
Multimodality imaging of neurodegenerative processes: Part I,
the basics and common dementias. 207: 871-882
(94) AJR 2016; Martin-Macintosh EL, et al. Multimodality imaging of neurodegenerative
processes: Part 2, atypical dementias. 207: 883-895
(95) J Nucl Med 2016; Catafau AM, et al.
Cerebellar amyloid-beta plaques: how frequent are they, and do
they influence 18F-florbetaben SUV ratios? 57:
1740-1745
(96) J Nucl Med 2017; Meles SK, et al.
Metabolic imaging in Parkinson disease. 58: 23-28
(97) J Nucl Med 2017; Mazere J, et al. 123I-iodobenzovesamicol
SPECT imaging of cholinergic systems in dementia with Lewy
Bodies. 58: 123-128
(98) J Nucl Cardiol 2017; De Rosa A, et al.
Myocardial 123I-metaiodobenzylguanidine scintigraphy
in patient with homozygous and heterozygous parkin mutations.
24: 103-107
(99) J Nucl Cardiol 2017; Guillaume L, Denis
A. Cardiac 123I-MIBG
scintigraphy: a window into the brain in Parkinsonism? 24:
108-110
(100) J Nucl Med 2017; Heiss WD, Weber Z.
Validation of MRI determination of the penumbra by PET
measurements in ischemic stroke. 58: 187-193
(101) J Nucl Med 2017; Whitewell JL, et al. 18F-FDG
PET in posterior cortical atrophy and dementia with Lewy bodies.
58: 632-638
(102) J Nucl Med 2017; Barthel H, Sabri O. Clinical utility of
amyloid imaging. 58: 1711-1717
(103) J Nucl Med 2017; Meyer PT, et al. 18F-FDG
PET in Parkinsonism: differential diagnosis and evaluation of
cognitive impairment. 58: 1888-1898
(104) J Nucl Med 2018; Villemagne VL. Selective tau imaging: der
stand der dinge. 59: 175-176
(105) J Nucl Med 2018; Devous MD, et al. Test-retest
reproducibility for the tau imaging agent flortaucipir F18. 59:
937-943
(106) AJR 2018; Zukotynski K, et al. PET/CT of dementia. 211:
246-259
(107) Radiographics 2018; Lundeen TF, et al. Signs and artifacts
in amyloid PET. 38: 2123-2133
(108) J Nucl Med 2019; Chiao P, et al. Impact of reference and
target region selection on amyloid PET SUV ratios in the phase 1b
PRIME study of aducanumab. 60: 100-106
(109) J Nucl Med 2019; Baker SL, et al. Effect of off-target
binding of 18F-flortaucipir variability in healthy
controls across the life span. 60: 1444-1451
(110) J Nucl Med 2020; Blazhenets G, et al. Predictive value of 18F-florbetapir
and 18F-FDG PET for conversion from mild cognitive
impairment to Alzheimer dementia. 61: 597-603
(111) J Nucl Med 2020; Mattay VS, et al. Brain tau imaging: food
and drug administration approval of 18F-flortaucipir
injection. 61: 1411-1412
(112) AJR 2020; Sakamoto F, et al. Diagnostic performance of 123I-FP-CIT
SPECT specific binding ratio in progressive supranuclear palsy:
use of core clinical features and MRI for comparison. 215:
1443-1448
(113) AJR 2021; Ponisio MR, et al. The role of SPECT and PET in
epilepsy. 216: 759-768
(114) Radiology 2021; Villemagne VL, et al. Molecular imaging
approaches to dementia. 298: 517-530