The computer-aided detection (CAD) algorithms that find, measure, and mark lung nodules on CT data are influenced by myriad factors in the imaging environment. Variables on the acquisition side include dose, acquisition protocol, and reconstruction methods. On the patient end are vagaries of lesion shape, attenuation, and location, to name a few.
But if the complexities of study design are headache-inducing, investigators are at least rewarded with a wide range of study targets with which to gauge CAD's clinical performance. As for results, the lessons taught by small studies performed in narrow imaging environments can be hard to assimilate as well. But when read between the lines and taken with a dash of salt, they can illuminate strengths and weaknesses in methods and suggest paths for improvement.
Part II of our series on automated CT nodule assessment (like part I) is based on presentations from the 2006 European Congress of Radiology (ECR) in Vienna. It explores the how and why of lung nodule assessment in a few CAD systems, evaluated in small studies.
Nodule assessment is often hampered by the lack of a histologic gold standard, but some of the researchers in this series had real biopsy-proven nodules to back up their expert readers. The results suggest, among other things, that current CAD algorithms may need more emphasis on the small, irregularly shaped nodules that constitute many primary lung cancers.
How does lung CAD evaluation compare to reading maximum intensity projections (MIPs) or thin-section images? A team from Grenoble, France, believes it depends to some extent on the reader. Does a prototype lung CAD system find biopsy-proven cancers or only suspicious nodules? It can find both, according to a Korean team, if readers are willing to wade through additional false positives to find them. And do lower doses affect nodule detection in CAD? Not necessarily, say researchers from the U.K., but low-dose protocols will lose you lesions in certain clinical scenarios, especially when CAD is looking for round lesions more characteristic of metastases.
CAD versus MIPs versus axial slices
Dr. Adrien Jankowski and colleagues from Centre Hospitalier Universitaire (CHU) in Grenoble, France, used data from the DepiSCAN lung screening trial to assess sensitivity differences between three readers using CAD, MIPs, and axial slices in 28 cases that had at least one follow-up CT study to aid in the assessment of ground truth.
Multidetector-row CT (MDCT) data were acquired on a 16-row scanner with 1-mm slice thickness and 0.8-mm overlapping reconstructions.
Three radiologists independently reviewed in a random order on a workstation three types of images: axial 1-mm images, axial 6-mm MIPs, and CAD system detections (LungCARE, Siemens Medical Solutions, Erlangen, Germany).
"Each radiologist read 84 sets of images in a different and random order, that is, three sets of images per CT (dataset including) 1-mm axial images, MIP slabs, and CAD detections," Jankowski said.
Lacking histopathological evidence, as is the case with most lung nodule studies, "ground truth" was based on the opinions of two expert chest radiologists working independently, and of course not the original three readers.
According to the results, 287 of 711 nodules (40.4%) nodules greater than or equal to 1 mm in diameter were identified as true positives by the expert panel.
The detection rates of the three independent observers with 1-mm axial images were 64 of 287 (22.3%), 86 (30%), and 136 (47.3%). When MIP images were added to 1-mm images, these rates rose to 123 of 287 (42.9%), 140 (48.8%), and 205 (71.4%) (p < 0.0001), respectively. And when CAD was added to 1-mm images, these rates were 145 of 287 (50.5%), 154 (53.7%), and 190 (66.2%) (p < 0.0001), respectively.
CAD detected 298 opacities; 107 of them were true-positive nodules (detection rate: 107 of 287; 37.3%). CAD showed 6.82 false positives per CT scan. Thirty-one nodules were detected by CAD only; they were smaller than other nodules (2.24 ± 0.9 versus 3.14 ± 1.7, p < 10-4).
MIP and CAD reduced the number of overlooked nodules on 1-mm images, and the additional nodules detected between MIP and CAD were different. Still, it would not be practical to skip the axial image review, as some nodules were seen only on the axial slices, Jankowski said in response to a question from the moderator.
CAD alone yielded 6.8 false positives per dataset. CT readers using CAD obtained very good interobserver agreement, with no interobserver differences in sensitivity.
For two of the three readers, the sensitivity of CAD was lower than with using MIPs alone and higher than using axial slices alone when nodules were 3 mm or larger.
"The reading time depended on reading technique for each reader. CAD was the most time-consuming technique and MIP the shortest reading times," Jankowski said. The study is among the first to compare the effects of MIP and CAD on reader sensitivity for pulmonary nodule detection, he said.
CAD finds lung cancers in addition to nodules
Lung CAD systems, including a few approved for clinical use, have been shown to detect additional lung nodules compared to the results of human readers alone. But the crucial question is how many of the detected nodules are really lung cancers?
"The effectiveness of CAD in detecting lung cancer has not been fully investigated," said Dr. Jin Mo Goo of Seoul National University in Korea in his ECR presentation.
The study sought to evaluate the performance of CAD in detecting both lung nodules and cancer. In all, 150 chest CT scans (section thickness of 3.2 mm or less) were assessed in a database that included 23 histologically proven lung cancers (15 adenocarcinomas, seven bronchial adenocarcinomas, and one non-small cell lung cancer; 5-18 mm in diameter, mean 11 mm) in 22 patients. Nodules were stable for at least two years, for a total of 352 nodules. The group used custom-made CAD software to find them.
"Ten were solid nodules, 12 were mixed ground-glass opacities, and one was a pure ground-glass opacity," Goo said.
Five chest radiologists and five radiology residents participated in the observer performance study, which consisted of five sessions of 30 cases each. When researchers found a nodule, they rated it for likelihood of its being a nodule and likelihood of malignancy, rating locations as well, he said. Finally, a jackknife alternative free-response receiver operating characteristic (JAFROC) analysis was used to compare the observers' performance of detecting nodules and cancer with and without CAD.
The JAFROC analysis showed that lung nodule detection was significantly increased with CAD for all readers (p < 0.01). CAD alone detected 18 of 23 lung cancers. One lung cancer was initially missed by all of the chest radiologists at initial reading without CAD. Twelve lung cancers were missed by four residents at initial reading, but four of these lung cancers were additionally detected with the use of CAD, Goo said.
However, because the false-positive detection rate also increased with the use of CAD, the overall performance of detecting lung cancers was not significantly different with and without CAD for all radiologists and subgroups (p > 0.05).
"Although the overall performance of detecting lung cancer by radiologists was not significantly affected by CAD, the use of CAD contributed to detecting additional lung cancers by less experienced radiologists," Goo said.
The study is important, the session moderator commented, because most CAD systems were trained on cases with multiple nodules. The nodules are usually from metastatic tumors that are often round and well-defined. The fact that the algorithm worked imperfectly on the highly irregular lesions in the cohort "suggests that it will probably be very useful to train CAD systems on these rather ill-defined and not perfectly round lesions which are typical for early lung cancer," he said.
Clinical scenario may determine optimal dose
A group from London's Charing Cross Hospital compared the results of automated lung detection from low-dose and regular-dose scans of the thorax. As with the Korean study, the algorithm may have benefited from training in irregularly shaped nodules typical of primary lung cancers.
A few papers on the topic have suggested that radiologists do miss nodules on low-dose CT, but that CAD can help detect malignancies on low-dose data, said Dr. Mary Roddie in her ECR presentation.
"The aim of this study was to use a commercially available CAD system, and see how it performed in the detection of small, biopsy-proven lung cancers, some of which had been obtained with low-dose CT and some with a conventional diagnostic dose," she said.
Of the 27 lung cancers studied, 16 were from a low-dose screening, ranging in size from 7-19 mm (median 15.5 mm, 10 of 16 solid). The other 11 cancers had been detected as indeterminate or suspicious nodules on conventional body CT (7-23 mm, median diameter 18 mm, all solid).
"The donor institutions provided reference truth coordinates for the location of the cancers, the details of their scanning parameters, and also the histopathological reports," Roddie said.
The CAD system (LungCAD, Medicsight, London) was optimized for solid nodules of 5-20 mm in diameter, and has some user-adjustable filter settings that can alter the degree of roundness and CT attenuation differences targeted by the algorithm. In a previous study, the system had produced 83% sensitivity overall for solid nodules, and 88% for nodules 7 mm and larger, she noted. Overall, 12 different settings were used.
For standard-dose thoracic CT (100-200 mAs), CAD detected between 8 and 9 of the 11 (73% to 82%) cancers, while on low-dose CT (40-60 mAs) only three to five of the 16 (19% to 31%) cancers were detected (p < 0.001).
"We wondered whether that might be related to the nonsolid cancers, so we analyzed it again just looking at the solid cancers," Roddie said. But analyzing the solid cancers worsened the results, with just one of nine (11%) of the solid cancers detected by CAD.
The algorithm was clearly more affected by mAs and noise than by cancer density, the group concluded. "But we felt also that it might have something to do with the irregular lesion shape in these patients," she said, adding that the study was too small to have great statistical power and was undertaken primarily to test the CAD system's interaction with radiologists.
"We felt that the important findings in this study were that CAD algorithms need to be optimized for different clinical scenarios," Roddie said. "And clearly the CAD that we tested that had probably been developed mainly on metastatic or benign round nodules was not perfected for the lung cancer detection, and was also being affected by the low mAs and image noise, and this was a more important factor than density or shape."
As for the filters included with the CAD system, reducing the sphericity of targeted nodules added false positives that the radiologist had to delete, but could potentially be helpful in targeting elongated lesions, she said. The other filter setting adjusts the target attenuation.
Noise a culprit again in CAD detection
Dr. Marco Das from the Mëlheimer Radiologie Institut at the University of Aachen in Germany presented another study comparing the effect of noise on nodule detection using a commercially available CAD scheme (LungCARE, Siemens Medical Solutions). Often, scans acquired with different parameters must be compared over time.
"One problem is we now have an increased number of cases to read, especially due to lung cancer screening," Das said. "Often, low-dose studies are used (for screening), and if a nodule is detected, the follow-up scan is not performed with low-dose settings."
The study looked at 20 datasets selected from patients with known intrapulmonary nodules. Images were acquired on a Siemens Somatom 16 scanner at 120 kVp, effective 100 mAs, 16 x 1.5-mm collimation, 2-mm-thick sections with 1.5-mm reconstruction intervals, and with a standard lung reconstruction kernel.
The raw data were processed by artificial noise software to simulate exposure using 10 effective mAs before being run through the CAD, and the results compared. Image noise was quantified by measuring the standard deviation in Hounsfield units of a syringe placed on the patient's sternum during imaging.
In all, 113 nodules (one to 13 nodules per case, average six; average size 78 mm3) were found by a consensus panel of two experienced radiologists with access to all imaging and CAD data.
 |
| Low-dose image (above) shows greater image noise than full-dose image below, which can affect the nodule detection algorithm. Images courtesy of Dr. Marco Das. |
 |
Compared with the expert readers, standard-dose CAD had an overall sensitivity of 77.6%, with a per-patient sensitivity of 84% and 1.8 average false positives per case. At the low-dose settings, CAD found 64 nodules for an overall sensitivity of 55% with a per-patient sensitivity of 67% and 1.5 false-positives per case. Interestingly, Das said, there was no statistically significant difference in false positives between the two settings.
 |
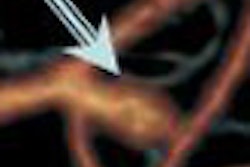
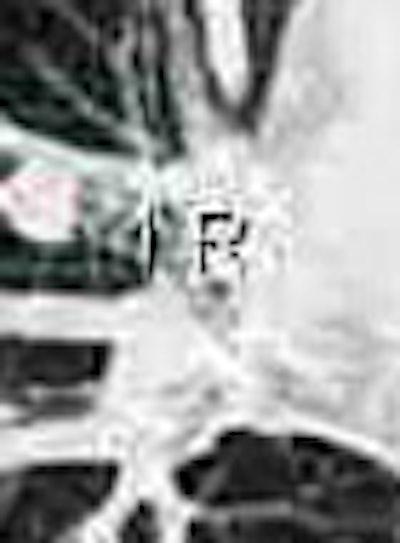
| The marked nodule (green) was deemed not clinically relevant. However, CAD detected it only at the full-dose setting, and not at low-dose (10 mAs). Image courtesy of Dr. Marco Das. |
Most nodules missed on CAD at the low-dose settings were smaller than 6 mm, he said.
"We could detect a statistically significant (sensitivity) difference between low-dose and standard-dose settings, but we did not detect a statistically significant difference for the false-positive rate," Das said. In a future study, CAD sensitivity as a second reader needs to be assessed, he said.
By Eric Barnes
AuntMinnie.com staff writer
May 16, 2006
Related Reading
Many positive CT scans resolve after short-term follow-up, April 28, 2006
Part I: Automated CT lung nodule assessment advances, April 17, 2006
CT measures post-transplant bronchiolitis obliterans severity, March 14, 2006
Trimming CT dose decreases lung CAD performance, January 12, 2006
ELCAP data suggest need to work up secondary lung lesions, January 9, 2006
Management strategies evolve as CT finds more lung nodules, August 19, 2005
Copyright © 2006 AuntMinnie.com