By Y. Ted Wu, Ph.D., Able Software
Determining the meaning or attributes of pixels within an image is a basic problem in 2-D/3-D medical imaging. When looking at a 3-D image with hundreds of 2-D cross-section slices, interpretation becomes a daunting task.
Fortunately, the classification of voxels and pixels into objects can be done on a computer as part of a process called image segmentation. Once pixels with similar characteristics are grouped together, 3-D models can be created for 3-D visualization and quantitative analysis applications.
A raw 3-D image, whether produced by CT, MRI ,or microscopy, comes as a 3-D array of voxels or pixels. Each voxel has a grayscale range from 0 to 65535 in the 16-bit pixel case, or from 0 to 255 in the 8-bit pixel case. Most medical imaging systems generate images using a 16-bit grayscale range. A 3-D image typically has a large number of pixels and is very computer- intensive for processing tasks such as segmentation and pattern recognition.
A segmented image, on the other hand, provides a much simpler description of objects that allows the creation of 3-D surface models or display of volume data. While the raw image can be readily displayed as 2-D slices, 3-D analysis and visualization requires explicitly defined object boundaries, especially when creating 3-D surface models.
To create a 3-D rendering of a brain from an MR image, for example, the brain needs to be identified first and its boundary marked. Image segmentation identifies the attributes of pixels and defines the boundaries for pixels that belong to the same group.
In addition, measurements and quantitative analysis for parameters such as area, perimeter, volume and length, can be obtained easily when object boundaries are defined. Because of the importance of identifying objects from an image, extensive research spanning several decades has been conducted on image segmentation. As a result, a number of image segmentation methods have been developed using fully automatic or semi-automatic approaches for medical imaging and other applications.
Vector-based object boundaries
Traditionally, 3-D imaging systems used a raster-based data structure, which is similar to a volume image, in which each pixel has a code to indicate what object it belongs to at that position. This structure has the advantage of being simple and almost identical to the original image, but it requires a huge amount of computer memory to store and computing power to process.
Interactive on-screen editing is complicated, however, when a 3-D object contains a huge number of pixels, as each pixel has to be updated or touched when its attributes are changed. While raster-based surface-rendering algorithms are quite robust, the resulting surface model can have millions of surface triangles or polygons that may not be suitable for applications such as rapid prototyping.
On the other hand, a vector-based data structure provides a more efficient way to represent regions and objects. When using vector-based data structure, a line segment consists of only two points, while a region or polygon is formed by a group of connected lines. Due to its abstract mathematical form, the vector-based structure uses very little computer memory and is easy to modify and fast to display.
When modifying a boundary, moving one point on a line segment to a new location may be all it needs to change the shape. Figure 1 shows the difference between raster-based and vector-based data structures.
 |
There are several applications and variations of image segmentation, including the use of thresholding, texture-based segmentation, and vector-based boundary editing.
Image segmentation by thresholding
Defining a region of interest before image segmentation limits processing to a defined region, thus avoiding the use of computing resources on irrelevant areas. It also reduces the amount of editing needed after image segmentation, as object boundaries are generated within the defined regions. Image segmentation by thresholding is a simple but effective approach for images containing solid objects that are distinguishable from the background or other objects in terms of pixel intensity values.
Figure 2 shows a simplified image histogram for such images with strong contrast between background and imaging object. The pixel thresholds are normally adjusted interactively and displayed in real time on the screen. When the values are defined properly, the boundaries are traced for all pixels within the range in the image. Grayscale thresholding works well with an image that has uniform regions and contrasting background.
 |
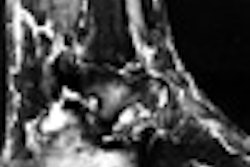
Thresholding is normally done interactively. Using two values to define the threshold range, the thresholds are adjusted interactively by showing all pixels within the range in one color and all pixels outside the range in a different color. Since the thresholds are displayed in real-time on the image, the threshold range can be defined locally and varied from slice to slice. All pixels within the range are segmented to generate the final boundaries. Figure 3 shows the result of interactive thresholding (using 3-D Doctor, Able Software, Lexington, MA).
 |
Texture-based segmentation
While image texture has been defined in many different ways, the repetition of a pattern or patterns over a region is a major characteristic. The pattern may be repeated exactly, or as a set of small variations on the theme, possibly a function of position.
In medical imaging, the objects are normally certain type of tissues such as blood vessels, brain tissue, and bones, which provide a rich set of texture information for image segmentation. For some objects with strong textures, texture-based segmentation generates more accurate object boundary than thresholding-based methods.
Texture-based segmentation begins with a user-defined training area, where texture characteristics are calculated and then applied as a pixel classifier to other pixels in one cross-section image or the entire volume to separate them into groups. Object boundaries are traced and their topological relationship is established. Figure 4 shows an example of texture-based segmentation.
 |
Vector-based boundary editing
Automated segmentation methods rarely generate perfect object boundaries, however. For 3-D imaging software, an easy-to-use boundary editor is an indispensable tool to allow for modification or even manual tracing of objects that have faint texture or weak edges.
While raster-based pixel editing is doable, it involves modifying a large number of pixels for even a small region. Vector-based boundaries are easy to edit and offer better integration with the original image, as they are displayed right on top of the original image and are treated as additional graphics layers. Vector-based boundary editing makes it possible to do 3-D imaging and analysis on even low-end PCs without loss of performance.
 |
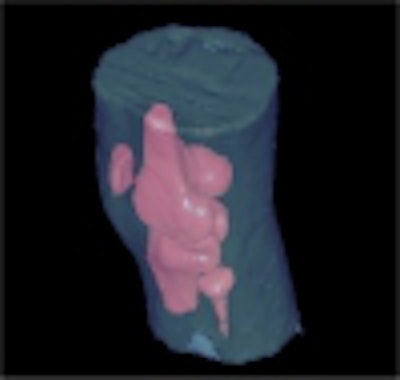
With vector-based editing, multiple objects can also be displayed in different colors and edited at the same time and in the same space where the original image is displayed. This kind of display is sometimes difficult to produce using raster-based methods on multiple objects, especially when they overlap or when one is part of another. Figure 5 shows the 3-D pelvis model created from the CT pelvis image.
By Y. Ted Wu, Ph.DAuntMinnie.com contributing editor
July 13, 2001
Mr. Wu is president and CEO of Able Software, a 3-D medical imaging software developer. The firm's 3-D Doctor software provides 3-D visualization, rendering, and measurement of CT/MR images.
References
1. Y. Wu and L. Yencharis, "Commercial 3-D Imaging Software Migrates to PC Medical Diagnostics," Advanced Imaging, Oct. 1998, pp.16-21
2. Y. Wu, "Raster, Vector, and Automated Raster-to-Vector Conversion", in Moving Theory into Practice: Digital Imaging for Libraries and Archives, Book Eds. by A.R. Kenney and O.Y. Rieger, 2000, Research Libraries Group
3. Y. Wu, P. Lemkin and K. Upton, "A fast spot segmentation algorithm for two-dimensional gel electrophoresis analysis," Electrophoresis, 1993, 14, 1351-1356
4. P. Lemkin, Y. Wu and K. Upton, "An efficient disk based data structure for rapid searching of quantitative two-dimensional gel databases," Electrophoresis, 1993, 14, 1341-1350
5. Y. Wu and D. Mislan, "Automated DNA sequencing: an image processing approach," Applied and Theoretical Electrophoresis, 1993, 3, 223-228
Click here to post your comments about this story. Please include the headline of the article in your message.
Copyright © 2001 AuntMinnie.com