A deep-learning algorithm can yield comparable performance to experienced thoracic radiologists in estimating the malignancy risk of pulmonary nodules on chest CT exams, according to research published online May 18 in Radiology.
In addition, their model significantly outperformed the previously developed Pan-Canadian Early Detection of Lung Cancer (PanCan) model, according to the multinational team of researchers led by Kiran Vaidhya Venkadesh of Radboud University Medical Center in Nijmegen, the Netherlands.
"As it does not require manual interpretation of nodule imaging characteristics, the proposed algorithm may reduce the substantial interobserver variability in CT interpretation," said senior author Colin Jacobs, PhD, of Radboud University Medical Center in Nijmegen, the Netherlands, in a statement from the RSNA. "This may lead to fewer unnecessary diagnostic interventions, lower radiologists' workload, and reduce costs of lung cancer screening."
The team's deep-learning algorithm, which consists of an ensemble of 2D and 3D convolutional neural networks, was trained to predict nodule malignancy using over 16,000 nodules from the National Lung Screening Trial. External validation was then performed on three different patient cohorts from the Danish Lung Cancer Screening Trial (DLCST).


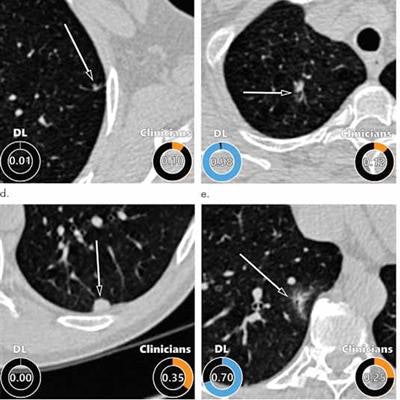
Examples of CT images in nodules from the Danish Lung Cancer Screening Trial (DLCST) with (a-d) high and (e-h) low agreement between the deep-learning algorithm and the clinicians for malignancy risk estimation. Numbers in rings on bottom left of each image are the algorithm's malignancy score, and numbers in rings on bottom right of each image are the clinicians' median malignancy score. The extent of the color filling is proportional to the malignancy risk (on a scale of 0 to 1, where 0 represents the lowest risk and 1 represents the highest risk). (a) Image shows a 15-mm spiculated and lobulated malignant nodule (arrow) classified correctly by the algorithm and clinicians. (b) Image shows an 11-mm smooth benign nodule (arrow) classified correctly by the algorithm and clinicians. (c) Image shows a 29-mm benign lesion (arrow) suspected to be a malignant nodule by both the algorithm and clinicians. This participant was diagnosed with pneumonia at clinical workup (Fig E4 [online]). (d) Image shows a 5-mm malignant nodule (arrow) called benign by both the algorithm and clinicians. The growth of the nodule can be seen from follow-up CT examinations (Fig E5 [online]). (e) Image shows a 15-mm part-solid malignant nodule (arrow) classified correctly by the algorithm and not suspected to be malignant by seven of 11 clinicians (Fig 6). (f) Image shows an 8-mm benign nodule (arrow) predicted to be moderately suspicious by the clinicians and called benign by the algorithm. (g) Image shows an 11-mm malignant nodule (arrow) predicted to be moderately suspicious by most clinicians but called benign by the algorithm. (h) Image shows a 16-mm benign lesion (arrow) classified correctly by the clinicians and predicted to be highly suspicious by the algorithm. Images and captions courtesy of the RSNA.
In addition, the researchers compared the algorithm's results to those of a group of 11 clinicians -- including four experienced thoracic radiologists -- who had independently assessed malignancy risk for all of the nodules in the cancer-enriched cohorts.
| Area under the curve (AUC) of deep-learning algorithm for distinguishing benign from malignant nodules | |||
| PanCan model | Thoracic radiologists | Deep-learning algorithm | |
| Full Danish Lung Cancer Screening Trial cohort | 0.90 | n/a | 0.93 |
| Cancer-enriched cohort with random benign nodules | 0.94 | 0.90 | 0.96 |
| Cancer-enriched cohort with size-matched benign nodules | 0.75 | 0.82 | 0.86 |
The differences in performance between the deep-learning algorithm and the PanCan model were statistically significant in the full DLSCT cohort (p = 0.046) and the cancer-enriched cohort with size-matched benign nodules (p < 0.001). The authors found no statistically significant difference between the performance of the algorithm and that of the four thoracic radiologists.
In the next step of their work, the researchers said they plan to improve the algorithm by incorporating clinical parameters like age, sex, and smoking history. In addition, they are also working on a deep-learning model that will analyze multiple CT exams.
Although the current algorithm is highly suitable for analyzing nodules at the baseline screening exam, it's important to compare growth and appearance on previous CT exams for nodules detected at subsequent screenings, according to the authors.
What's more, the researchers are investigating how to effectively integrate chest CT imaging features related to chronic obstructive pulmonary diseases and cardiovascular disease.
In an accompanying editorial, Martin Tammemägi, PhD, of Ontario Health, noted that the high AUC achieved by the deep-learning algorithm on the size-matched subset of cases indicates that it's picking up valuable predictive information from nonsize factors.
"It would be informative to find out what those factors are, as they may shed light on carcinogenic mechanisms and possible unique ways to estimate risk of developing cancer or to improve selection criteria for screening," Tammemägi wrote.
Although the model isn't interpretable and does not provide a rationale for high-risk scores, it may be worth the effort to gain insights into how it arrives at its conclusions, according to Tammemägi.
"The work described by Venkadesh et al represents a good start, but much exciting work remains to complete the journey," Tammemägi wrote.