An artificial intelligence (AI) algorithm trained using chest x-rays and associated free-text radiology reports was able to find and detect the severity of pulmonary edema, potentially helping physicians to anticipate heart failure and manage conditions, according to its developers.
Researchers from the Massachusetts Institute of Technology (MIT), Beth Israel Deaconess Medical Center (BIDMC), and Philips Healthcare found that the algorithm, which categorizes edema on a scale ranging from 0 (normal) to 3 (alveolar edema), was able to identify the correct edema levels as determined by radiologists on more than half of test cases. It also correctly diagnosed level 3 cases 90% of the time.
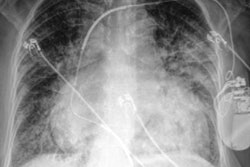
 MIT's machine-learning algorithm quantifies edema on chest x-rays on a scale from 0 (normal) to 3 (alveolar edema). Image courtesy of MIT CSAIL.
"The joint image-text representation learning framework incorporates the rich information present in the free-text radiology reports and significantly improves the performance of edema assessment compared to learning from images alone," the authors wrote in their article, published online recently in arXiv.org. "Moreover, our experimental results show that joint representation learning benefits from the large amount of unlabeled image-text data."
The researchers, led by co-first authors Geeticka Chauhan and Ruizhi Liao, of MIT's Computer Science and Artificial Intelligence Laboratory (CSAIL), will present their results October 5 in a session at the virtual International Conference on Medical Image Computing and Computer-Assisted Intervention (MICCAI).
The researchers trained and tested their algorithm using 247,425 frontal-view radiographs and associated free-text radiology reports from the MIMIC-CXR database. Of these, 6,743 included radiographs from congestive heart failure patients that included labels of edema severity information by experts.
The authors set aside 531 of these labeled pairs of images and reports for testing, using the remaining 6,212 labeled image and text pairs and approximately 240,000 unlabeled image-text pairs for training.
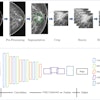
"Our model can turn both images and text into compact numerical abstractions from which an interpretation can be derived," said Chauhan in a statement. "We trained it to minimize the difference between the representations of the x-ray images and the text of the radiology reports, using the reports to improve the image interpretation."
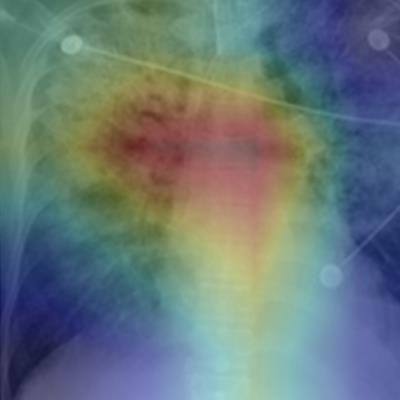
Their model also shows the parts of the image and report that corresponded to its prediction. They then assessed the performance of several variants of their model, including one trained using only the labeled images and another trained using both the labeled images and unlabeled images and reports. Performance was compared with classifications of edema levels made by expert radiologists on the test set.
| Performance of AI models on test set for identifying and classifying level of edema | ||
| Model trained using only labeled images | Model trained in a semisupervised manager on labeled images and nonlabeled images and reports | |
| Area under the curve (AUC) for identifying no edema (level 0) vs. three levels of edema | 0.74 | 0.81 |
| AUC for identifying alveolar edema vs. lower levels of edema severity and normal cases | 0.78 | 0.90 |
Chauhan said that she's hopeful future efforts in this area will yield more detailed, lower-level image-text correlations, enabling clinicians to develop a taxonomy of images, reports, disease labels, and relevant correlated regions.
The MIT researchers said they are now working with BIDMC and Philips to integrate the algorithm this fall into the workflow at the institution's emergency room.