It was a very hot day and everything was sticky when I threw out my father's pathology slides.
I had done the unthinkable, throwing away his curated collection of slides shown over 20 years with the New Jersey Society of Pathologists.1 His autopsy knife, intended for brain sections, moved with me twice before finally succumbing to the need to downsize.
The slides were everything, a tactile, interactive way to look at tissue and to learn about disease. A photograph was not the same, representing only a window to the information contained in a slide, without the ability to seamlessly glide in and out of focus and appreciate the nuanced information held between the coverslip and the slide, far away from digital pathology archiving.
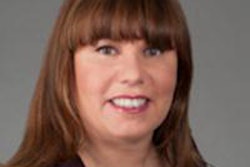
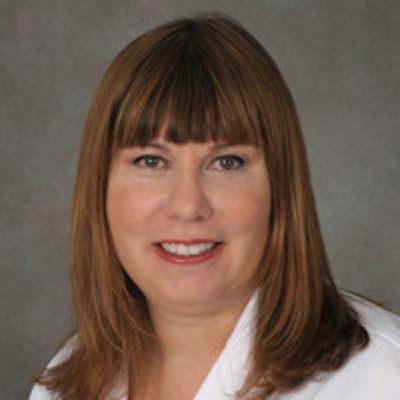
 Dr. Mary Morrison Saltz.
Today, using a Virtual Microscope,2 not only can we image the whole slide, we can zoom in and out and mark up the slide as needed. Whole-slide images (WSIs) can be seen in a pathology PACS, enabling long-distance interpretation of images, long-distance consultations, and archiving of virtual slides without the need to take up space in my attic!
More interesting still, the evolving field of pathomics turns pixels into meaningful information.3 We can see beyond the pathologist's eyes to decode cellular features that may change the way we view cancer.
In medical school, we learned early on that lots and lots of blue nuclei are very bad -- that the prognosis is not good. Of course, this is a gross oversimplification and certainly not even always true, but it points to the importance of the nuclear appearance in tissue when making a diagnosis of cancer from a hematoxylin and eosin (H&E) stained slide.
Pathomics today concentrates on the nuclei within a whole-slide image to inform us of the malignant characteristics of a tissue. Currently, sophisticated mathematical algorithms can delineate and mark all of the nuclei on each slide -- and as there are up to about 1 million nuclei per slide and around 100 features extracted per nucleus, that is a lot of information!
Data-intensive scientists today are working with our national laboratories, which house some of the fastest computers in the world, to analyze these data.
Pathomics is to pathology as radiomics is to radiology. As the radiology community is well-aware, radiomics refers to "the comprehensive quantification of tumor phenotypes by applying a large number of quantitative image features."4
Accurately delineating the tumor is the first hurdle in radiomics. It has been shown that standardizing the performance of radiologists in delineating tumor and edema in glioblastoma patients adds prognostic information about disease outcomes.5
Replacing the radiologist by automating tumor segmentation is not so easy! There are international competitions dedicated to recognizing the teams that can do the best job at replacing us in tumor delineation.6 While automated tumor segmentation is important for radiomics, it is mission-critical to automate nuclear segmentation in pathomics, as the sheer number of nuclei makes this an impossible task to complete manually.
To this end, similar challenges exist to promote competitions to improve nuclear segmentation on whole-slide images.7 Once the objects (tumors or nuclei) have been segmented, then multiple selected mathematical features are computed for each object.
Making sense of all these data, and learning what new information is impactful and what is noise, is important before we can hang our hat on any findings. Approximately 600 radiomic features can be extracted from a segmented object.8
What, really, does an extracted feature mean? How can we know? Some of this has been sorted out.
In radiomics, one example is from a 2014 paper in Nature Communications looking at head and neck cancer in which "results reveal that data contain strong prognostic information ... and are associated with the underlying gene expression patterns."4
Earlier work from 2012 in pathomics also shows that nuclear feature clusters are associated with differing patient outcomes.9
Feature analysis from radiomics and pathomics must be integrated with the bigger clinical picture -- patient demographics, tumor type and stage, metabolomics, genomics, and all the myriad other information constantly evolving as important in cancer care.
Pathomic data can be aggregated at the nuclear level, region-of-slide level, or patient level. This is a powerful way to look not only at the overall patient, but also at tumor heterogeneity and anatomic location of cells or groups of cells, for example, within a gland or along a vessel. By integrating and understanding the vast data generated, we hope to create a unique disease "fingerprint" that allows patient-centered precision care.
Today we have the promise of using cutting-edge technology, including some of the fastest computers in the world, to put patients and their personalized diagnoses at the center of tailored and targeted therapy and to advance the treatment and understanding of cancer.
Is it diagnostic yet? I don't think so. But will it be soon? I believe so!
References
- New Jersey Society of Pathologists website. http://www.njpath.org/. Accessed June 17, 2016.
- Ferreira R, Moon B, Humphries J, et al. The Virtual Microscope. Proc AMIA Annu Fall Symp. 1997:449-453.
- WSI Image Analysis. KASM Life Sciences website. http://kasmlifesciences.com/digital-pathology-solutions/wsi-image-analysis/. Accessed June 17, 2017.
- Aerts H, Velazquez E, Leijenaar R, et al. Decoding tumor phenotype by noninvasive imaging using a quantitative radiomics approach. Nat Commun. Published online June 3, 2014.
- Gutman D, Cooper L, Hwang S, et al. MR imaging predictors of molecular profile and survival: Multi-institutional study of the TCGA glioblastoma data set. Radiology. 2013;267(2):560-569.
- Multimodal Brain Tumor Segmentation Challenge. http://braintumorsegmentation.org/. Accessed June 17, 2016.
- MICCAI 2015 - Computational Brain Tumor Cluster of Events (CBTC). Cancer Imaging Archive website: https://wiki.cancerimagingarchive.net/pages/viewpage.action?pageId=20644646. Accessed June 17, 2016.
- Radiomics could change role of radiologists. RSNA website. http://www.rsna.org/NewsDetail.aspx?id=14704. Accessed June 17, 2016.
- Cooper L, Kong J, Gutman D, et al. Integrated morphologic analysis for the identification and characterization of disease subtypes. J Am Med Inform Assoc. 2012;19(2):317-323.
Dr. Mary Morrison Saltz is a board-certified diagnostic radiologist. She is currently chief medical information officer for the Stony Brook Cancer Center, a member of the Stony Brook department of radiology, an adjunct member of the department of biomedical informatics, and chief clinical integration officer for community practice initiatives at Stony Brook Medicine.
She has also served as chief medical officer for Hospital Radiology Partners and as radiology chair and service chief at hospitals in Florida, Ohio, and Georgia. Dr. Saltz is a member of the American College of Physician Executives, the American College of Radiology, and RSNA, and she sits on the Citizens Advisory Council of the Duke Cancer Institute.
A hands-on leader, Dr. Saltz's expertise is working hand-in-hand with hospital administration to guide radiology teams to success. Dr. Saltz has led quality assurance programs in Florida and Ohio, and she served as chief quality officer for community practice initiatives at Emory Healthcare. She also has more than 20 years of private-practice experience.
She is a graduate of McGill University, with a Bachelor of Science in Human Genetics, and Duke University, where she obtained her Doctor of Medicine. Her postgraduate education included a residency at Boston University, where she served as chief resident, and a fellowship in interventional abdominal radiology at Massachusetts General Hospital.
The comments and observations expressed herein do not necessarily reflect the opinions of AuntMinnie.com.

