An artificial intelligence (AI) algorithm worked well to assess sarcopenia -- a risk factor for future hip fractures and death -- on both chest and abdominal CT scans, according to research published August 18 in the American Journal of Roentgenology.
A team of researchers led by Dr. Perry Pickhardt of the University of Wisconsin in Madison, WI, used a deep-learning model to retrospectively measure muscle at both the L1 and L3 vertebra levels for over 9,000 asymptomatic adults who had received CT colonography for colorectal cancer screening.
The researchers found that AI analysis of the L1 vertebrae on CT worked just as well as measurements at the L3 level, which has already been established as the gold standard for sarcopenia assessment. The L1 measurements also performed similarly to clinical risk scores.
Being able to focus on the L1 vertebrae will expand the range of CT scans that can be analyzed by AI, Pickhardt et al pointed out.
"Alternative use of the L1 rather than L3 level for CT-based muscle measurements allows sarcopenia assessment using both chest and abdominal CT scans, greatly increasing the potential yield of opportunistic CT screening," the authors wrote.
To date, most studies using deep learning to assess for sarcopenia have focused on the L3 level. In their research, the authors sought to also evaluate the performance of L1 muscle measurements in consecutive asymptomatic adult patients who had received low-dose, unenhanced abdominopelvic CT exams for colorectal cancer screening at their institution between 2004 and 2016.
The 9,223 adults in the study had a mean age of 57 ± 8 years and included 4,071 men and 5,152 women. Over the median of 8.8 years of clinical follow-up, 219 (2.4%) had a hip fracture and 549 (6%) died.
The researchers retrospectively applied their previously validated deep-learning model to measure the mean attenuation of the muscle to assess for myosteatosis (sarcopenia), as well as to measure the cross-sectional area for myopenia. Both measurements were calculated on the CT scans at the L1 and L3 vertebral levels.
Next, they compared the performance of the AI-calculated L1 and L3 measurements for predicting hip fracture and death. In addition, they evaluated these measures in comparison with two commonly used clinical risk scores: the fracture risk assessment calculator (FRAX) and the Framingham risk score (FRS).
| Area under the curve for AI predictions of hip fracture and death | |||
| Clinical risk score (FRAX for hip fracture, FRS for death) | AI measurements of muscle attenuation at L1 vertebrae | AI measurements of muscle attenuation at L3 vertebrae | |
| Hip fracture (5 years) | 0.710 | 0.717 | 0.709 |
| Death (5 years) | 0.688 | 0.737 | 0.721 |
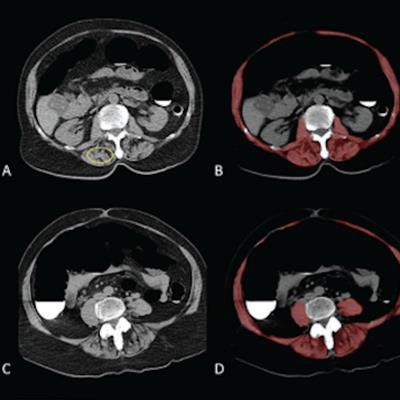
![Sarcopenia (myosteatosis) at screening CT colonography in a 79-year-old woman with subsequent hip fracture. Image at L1 vertebral level without (A) and with (B) overlay of automated skeletal muscle segmentation (B, red). Intramuscular fat is present within paraspinal muscles (A, yellow circle). Mean muscle attenuation is similar for manually placed ROI (1.8 Hounsfield units [HU]) and automated tool (3.9 HU), being markedly decreased for both approaches. Muscle cross-sectional area is relatively preserved when intramuscular fat is included. CT images at L3 level without (C) and with (D) muscle segmentation demonstrate similar findings. E. Hip radiograph demonstrates left intertrochanteric femoral fracture that occurred when the patient fell two years later. The patient died four years after falling. Images courtesy of the American Journal of Roentgenology.](https://img.auntminnie.com/files/base/smg/all/image/2021/08/am.2021_08_19_18_16_0066_2021_08_19_AI_sarcopenia.png?auto=format%2Ccompress&dpr=2&fit=max&q=70&w=700) Sarcopenia (myosteatosis) at screening CT colonography in a 79-year-old woman with subsequent hip fracture. Image at L1 vertebral level without (A) and with (B) overlay of automated skeletal muscle segmentation (B, red). Intramuscular fat is present within paraspinal muscles (A, yellow circle). Mean muscle attenuation is similar for manually placed ROI (1.8 Hounsfield units [HU]) and automated tool (3.9 HU), being markedly decreased for both approaches. Muscle cross-sectional area is relatively preserved when intramuscular fat is included. CT images at L3 level without (C) and with (D) muscle segmentation demonstrate similar findings. E. Hip radiograph demonstrates left intertrochanteric femoral fracture that occurred when the patient fell two years later. The patient died four years after falling. Images courtesy of the American Journal of Roentgenology.
Sarcopenia (myosteatosis) at screening CT colonography in a 79-year-old woman with subsequent hip fracture. Image at L1 vertebral level without (A) and with (B) overlay of automated skeletal muscle segmentation (B, red). Intramuscular fat is present within paraspinal muscles (A, yellow circle). Mean muscle attenuation is similar for manually placed ROI (1.8 Hounsfield units [HU]) and automated tool (3.9 HU), being markedly decreased for both approaches. Muscle cross-sectional area is relatively preserved when intramuscular fat is included. CT images at L3 level without (C) and with (D) muscle segmentation demonstrate similar findings. E. Hip radiograph demonstrates left intertrochanteric femoral fracture that occurred when the patient fell two years later. The patient died four years after falling. Images courtesy of the American Journal of Roentgenology.The researchers also noted that the muscle cross-sectional area measurements at both L1 and L3 were less predictive of hip fracture and death than the muscle attenuation measurements and clinical risk scores. These muscle area measurements produced a five-year AUC of 0.521 and 0.571, respectively, for hip fracture, and 0.536 and 0.544, respectively, for death.
Nonetheless, the comparable performance of the L1 and L3 muscle attenuation measurements demonstrates that chest CT exams could also be utilized to opportunistically predict future hip fractures and death.
"Because L1-level muscle measures can generally be derived from both chest and abdominal CT scans, use of the L1 level, rather than the L3 level, increases the overall potential yield of opportunistic CT screening for sarcopenia," the authors concluded.