Quantitative analysis with artificial intelligence (AI) of sequential CT exams in COVID-19 patients shows promise for standardized assessment and monitoring of disease progression, according to research published online March 25 in Scientific Reports.
Researchers from the U.S. National Institutes of Health (NIH) and graphics processing unit developer Nvidia collaborated to retrospectively apply an AI algorithm to segment the lung on serial chest CT exams from 29 patients with mild cases of COVID-19. After correlating laboratory results with the AI analysis and manual segmentations of opacities on CT, they found distinctive patterns and peaks in relation to onset of symptoms.
As a result, generalized dynamic curves based on these quantitative CT findings could potentially be used to assess mild COVID-19 cases and identify those that may become more severe, according to the researchers led by first authors Dr. Michael Kassin; Nicole Varble, PhD; and Maxime Blain of the NIH Clinical Center.
"Metrics for comparison could provide valuable clinical reference data for early detection of deviation from the expected disease course, which could potentially inform early medical countermeasures, therapeutic decision making, or clinical trial response criteria," the authors wrote. "Characterization of correlative patterns in such readouts can potentially identify patients with COVID-19 pneumonia by defining extreme deviations from standardized curves for patients with mild disease."
The researchers sought to evaluate the dynamics of chest CT opacity subtypes in COVID-19 before and after onset of symptoms. They utilized the Clara AI segmentation model (Nvidia) to automatically segment the total lung volume on serial chest CT exams in 29 mild COVID-19 patients from a single center in an outbreak zone.
These patients had a total of 121 serial CT exams and 279 lab measurements over an average of 50 days, which included patients with mild or moderate initially asymptomatic pneumonia. None of the patients required admission to the intensive care unit or intubation.
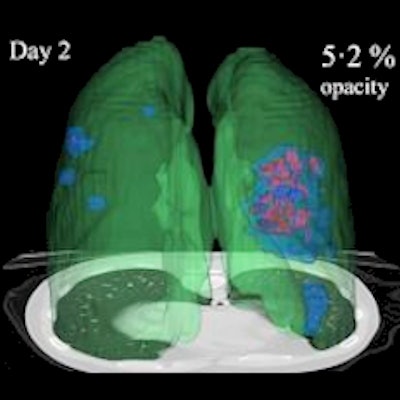
After verifying the AI lung segmentation results, radiologists then manually segmented the lung opacities and noted the opacity subtypes. Next, the researchers employed generalized temporal curves to correlate the CT data with lab measurements such as blood cell count and procalcitonin levels. 3D visualizations were also used to reconstruct the evolution of COVID opacities.
 3D image visualizations show the evolution of COVID opacities over the course of the disease. Images courtesy of Nvidia.
The researchers found that lung opacities appeared in an average of 3.4 ± 2.2 days prior to symptom onset and peaked an average of 0.6 ± 3.1 days after symptoms began. Ground-glass opacity onset was earlier, and it resolved later than consolidation, according to the authors. As for lab results, lactate dehydrogenase and C-reactive protein peaked earlier than procalcitonin and leukopenia.
Dynamic reference curves based on these results could potentially be useful for clinical triage of borderline patients, and they may inform the relative disease status of positive SARS-CoV-2 patients, the researchers speculated.
"Certainly a better understanding of serial disease changes on CT and labs over time could enlighten healthcare decision-makers facing off against an incompletely understood and novel virus in the context of medical countermeasures, chronic lung effects, or mutational variants," they wrote.