Health maintenance organizations (HMOs) are famous for their ability to cut healthcare costs -- for better or for worse. But not even HMOs were able to curb growth in advanced diagnostic imaging, according to a new study in the June 13 issue of the Journal of the American Medical Association.
The study found that growth rates for CT tripled, while rates for MRI quadrupled. The findings have ramifications beyond the healthcare utilization debate, according to the authors, as the growth is also contributing to higher levels of patient exposure to radiation, which also increased over the study period.
Beyond fee for service
Studies examining medical imaging cost and dose trends have tended to focus on fee-for-service models of payment used in hospitals and clinics, which generate more money when more scans are performed. Some experts have suggested that the situation would be different in the world of closed, integrated healthcare systems, where such financial incentives do not exist.
But this isn't the case, according to lead author Dr. Rebecca Smith-Bindman of the University of California, San Francisco.
"You would imagine that the rate of increase would be lower," Smith-Bindman said in a statement about the study. "[But] our results showed very similar growth in imaging within these integrated settings as has been shown outside of these settings."
Smith-Bindman and colleagues retrospectively analyzed electronic records of members of six large healthcare systems, including between 1 million and 2 million patients each year from 1996 to 2010. (The six healthcare systems included Group Health Cooperative in the state of Washington; Kaiser Permanente in Colorado, Georgia, Hawaii, Oregon, and Washington; and Marshfield Clinic and Security Health Plan in Wisconsin.) The group calculated advanced diagnostic imaging rates and cumulative annual radiation exposure from medical imaging (JAMA, June 13, 2012, Vol. 307:22, pp. 2400-2409).
Members of the health plans underwent a total of 30.9 million imaging exams during the 15-year study time frame, for an average of 1.18 tests per person per year. Thirty-five percent of these tests were advanced diagnostic imaging (CT, MRI, nuclear medicine, or ultrasound).
Across the six sites, the percentage of exams per modality was comparable. However, there were differences across the health systems in the rates of imaging per 1,000 members for each exam type. The researchers found that between the highest and lowest sites:
- Angiography/fluoroscopy use ranged from 23 to 103 exams
- CT use ranged from 136 to 200 exams
- MRI use ranged from 55 to 88 exams
- Nuclear medicine use ranged from 31 to 85 exams
- Radiography use ranged from 681 to 870 exams
- Ultrasound use ranged from 235 to 344 exams
The team's analysis showed striking variation from system to system, with some types of imaging being done five to 10 times more often in one system compared to the others. This is a significant finding because on the national level there's the belief that removing financial incentives by changing the fee structure of radiological exams and capping reimbursements will counter the rise in imaging rates, the team wrote.
The researchers also found that radiography and angiography/fluoroscopy rates were fairly stable over the time period, while the use of advanced diagnostic imaging changed dramatically.
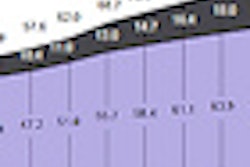
Imaging exams per 1,000 members by modality
|
CT exams tripled between 1996 and 2010, going from 52 to 149 exams per 1,000 members (7.8% annual growth). MRI exams quadrupled during the time period, from 17 to 65 exams per 1,000 members (10% annual growth) and ultrasound use approximately doubled (134 to 230 exams per 1,000 members). Nuclear medicine rates decreased, however, from 32 to 21 exams per 1,000 members, although PET imaging rates increased by 57% (0.24 to 3.6 exams per 1,000 enrollees).
These increases translated into increased patient exposure to radiation, Smith-Bindman's team wrote. For example, the mean per capita effective dose for CT rose from 1.2 mSv in 1996 to 2.3 mSv in 2010.
In addition, the percentage of health plan members who received high or very high radiation exposure during a given year (more than 20-50 mSv or more than 50 mSv, respectively) approximately doubled over the years -- due specifically to increased CT use. In 1996, CT accounted for 5.7% of exams and 30.3% of member-patients' exposure to radiation; by 2010, CT accounted for 12% of exams and 67.8% of radiation exposure.
"A recent report in the Lancet showed a direct association between exposure to CT and cancer risk in children," study co-author Diana Miglioretti, PhD, of the Group Health Research Institute in Seattle, said in a statement. "In our study cohort, 10% to 20% of children who underwent a single head CT received radiation doses in the range found to triple the risk of brain cancer or leukemia in the Lancet study."
The increase in imaging use over the study time frame was probably driven by a number of factors, including improvements in technology that have allowed for expanded clinical applications, as well as patient- and physician-generated demand and the practice of defensive medicine -- similar factors that affect imaging use in fee-for-service settings, according to Smith-Bindman and colleagues.
"It's not just that we're doing more advanced imaging tests, we are also doing these tests in such a way that the tests deliver higher -- and more variable -- doses of radiation," Smith-Bindman said. "I am concerned that physicians have lowered their threshold for advanced imaging so much that it is now used even when they may not believe it is necessary or will really change their management of the patient."