A new computer-aided detection (CAD) scheme can robustly detect vertebral compression fractures on spine CT images. The algorithm was developed by a team led by Dr. Ronald Summers, PhD, from the U.S. National Institutes of Health (NIH).
In 43 patients, most of whom had fractures, the CAD algorithm generated 88% sensitivity, with a false-positive rate of less than one per patient, according to the study team. The CAD algorithm uses what the researchers call a "height compass" scheme to evaluate the spatial distribution in the axial plane of compression injuries based on the expected height of each vertebra.
"We showed how a height compass could provide a uniform platform to detect vertebral body compression fractures," Summers said in a presentation at the RSNA 2014 meeting.
A common type of fracture
Vertebral compression fractures are the most common type of osteoporotic fracture, affecting nearly one in every 1,000 people over a lifetime. Radiographs, CT, and MRI scans are typically used to diagnose vertebral compression fractures.
 Dr. Ronald Summers, PhD, from NIH.
There is evidence, however, that the great majority of these fractures are not properly diagnosed and treated, according to Summers, who is a senior investigator in NIH's Imaging Biomarkers and Computer-Aided Diagnosis Laboratory.
"The purpose of this project was to develop a quantitative imaging system to detect and analyze compression fractures on CT, and the method chosen was to develop a vertebral height compass to distinguish fractures from nonfractured vertebrae," he said.
The goal with the height compass is to characterize the axial plane distribution of the compression injury.
"In other words, was it anterior, posterior, lateral, or central -- and what is the degree of height loss?" Summers said.
How it works
The CAD methodology unfolds in four main steps: spine segmentation and partitioning, endplate detection, height distribution computation, and quantitative compression fracture analysis.
"The first step is to take a curved planar reformation; these are standard sagittal and coronal reformations, but instead we use the centerline of the spinal canal to get normalized centerlines," Summers explained. "We perform partitioning using a [published] method ... where green lines indicate vertebral disks and a red line is the spinal canal."
Next comes vertebral endplate detection, which displays superior endplates in green and inferior ones in yellow. Because vertebral endplates are small and close to each other, the method uses a local intensity maximum calculation to delineate them precisely, Summers said.
The craniocaudal, anterior-posterior, and transverse axes of the vertebral body are then computed, forming a local coordinate system. Once a projection along the craniocaudal axis between endplates of the same vertebra is located, separation distance can be calculated.
"You can get varying degrees of pancake-like fractures in different shapes ... and sometimes the fractures show a uniform loss of height," he said.
Training CAD with a height compass
To create a height compass, each vertebral body is partitioned into 17 axially concentric cells, and each cell's height is quantified. The mean height in each of the 17 sectors is used as its height value.
The height compass has a total of 69 features, showing the height value in each sector, the height ratio relative to the average of the three vertebrae above and below each sector, and finally the vertebral level or height, Summers said.
Summers, along with Jack Yao, PhD, and Dr. Joseph Burns, PhD, who is now at the University of California, Irvine, used vertebral height distribution and height ratio relative to the adjacent vertebrae as features to train and test the computer system. They employed 10-fold cross-validation to evaluate its performance.
In all, there were 43 patients (mean age, 70 ± 13 years). Thirty-two of the patients had reported compression fractures and 11 did not. The study team evaluated 656 vertebrae, including 88 with compression fractures.
High sensitivity for fracture detection
The results showed sensitivity of 0.88 (77/88; 95% confidence interval: 0.81-0.93), with a false-positive rate of 0.63 per patient. There was only one false positive among the 11 control cases with no fractures.
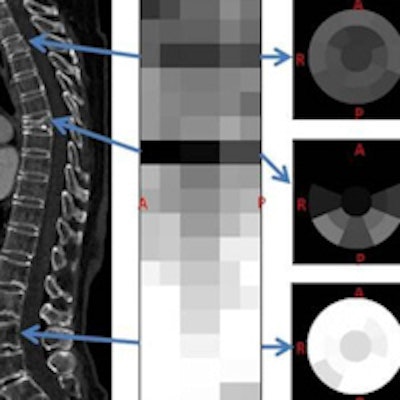
 83-year-old woman with compression fracture at T3 and T7. Curved sagittal reformation; sagittal view of stacked height compasses at T3, T7, and L3 (normal); and free-response receiver operator characteristics (FROC) curve. Image courtesy of Jack Yao, PhD, and Dr. Ronald Summers, PhD.
Compression fracture deformities ranged from 4% to 63% in maximum degree, and they were most often found in the T7 and L1 vertebral bodies. Most false-positive detections resulted from Schmorl's nodes, an indentation in the endplate, and image artifacts occurred at the topmost and bottommost vertebrae. The most common source of false negatives was multiple adjacent compressed vertebrae.
The system does an excellent job of detecting, localizing, and generating quantitative statistics for vertebral body compression fractures on CT, Summers concluded.
"Quantitative fracture assessment has potential to guide patient management and assist ongoing efforts to develop clinically relevant standards for classification of vertebral compression fractures," he said.