Using CT to measure cardiac fractional flow reserve (FFR) -- measuring the shape and speed of blood flow in the heart and coronary arteries -- is a potential game changer that could turn everyday coronary CT angiography (CCTA) scans into a one-stop cardiac assessment tool, taking over some imaging tasks from other modalities.
CT-based FFR measurements can accurately show the functional impact of any coronary artery stenosis without the need for extra radiation, risk, drugs, or special imaging procedures, according to a presentation by Dr. James Min, from Cedars-Sinai Medical Center, at the International Society for Computed Tomography (ISCT) annual meeting in San Francisco in June.
Traditionally, fractional flow reserve measurements have been performed during invasive coronary angiography, a technique that has emerged as the only accurate way to gauge lesion-specific ischemia or the hemodynamic significance of coronary artery stenosis, Min said. For guiding therapy, FFR measurements are preferable to stress myocardial perfusion imaging (MPI) because the latter doesn't permit the assessment of lesion-specific ischemia. As a standalone test, CCTA is fine for anatomy, but it's less accurate in gauging the physiological impact of stenosis.
Moreover, FFR-guided coronary revascularization improves the long-term clinical outcome of patients with coronary artery disease (CAD), Min said. And it's the ischemia-guided measurement tool that has been shown to result in event-free survival.
"FFR is defined by the ratio of maximum myocardial blood flow in a diseased artery to blood flow in the hypothetical case that the artery is normal," Min said. "But FFR is an invasive technique that requires a pressure wire to come past an epicardial stenosis to measure the pressure at maximal hyperemia and measure the pressure in the proximal aorta simultaneously."
CCTA correlates very favorably with angiographic estimates of coronary artery stenosis, of course, "but it's fairly unreliable in its prediction of which lesions are ischemic and which lesions are not," said Min, who is co-director of cardiac imaging and director of imaging research at Cedars-Sinai. "So the question then arises whether or not we can determine fractional flow reserve from CTA, and it appears that we can," he said.
 |
| All images courtesy of Dr. James Min. |
Up in the air
Similar calculations of fluid flow have been around for decades, but they had nothing to do with cardiac function. Traditionally, they were used by engineers to design planes that fly using computational fluid dynamic modeling, Min said.
"Using input data such as the geometry of how that plane is made -- the fluid properties such as the velocity and density of air, as well as boundary conditions such as the velocity of air that's incoming relative to the wing as well as the atmospheric pressure -- these data can be computed on supercomputers to find out what the lift and drag on a plane is."
Similar "but much more complicated" principles are used to measure coronary blood flow and pressure, Min said. "Using computational fluid dynamic modeling, you can get patient-specific geometry, you can get left ventricular mass, [and] you can look at the relationship of the epicardial vessels to the smaller branch vessels and the heart vessel interactions between these vessels and the mass," Min said. "You can model the microcirculatory resistance as well as the fluid properties of blood, and you can model hyperemia -- or adenosine-modulated hyperemia -- to look at the physiologic changes."
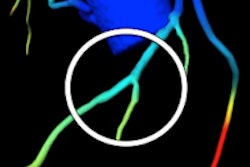
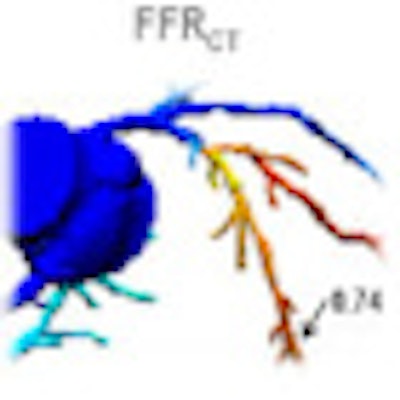
The CT-FFR analysis tool, developed at Stanford University, runs on a supercomputer using raw DICOM data from any existing CTA scan. After constructing a 3D map of the heart, a computational model of the hemodynamics of arteries provides readings for FFR at any point on the map, enabling a cardiologist to assess the severity of stenosis in a vessel.
 |
| CT fractional flow reserve calculated from coronary CTA. |
FFR test
How good are physiologic data derived from CCTA images? To find out, Min and colleagues from several leading hospitals in the U.S. and Europe launched the Diagnosis of Ischemia-Causing Stenoses Obtained Via Noninvasive Fractional Flow Reserve (DISCOVER-FLOW) study. "We looked at the diagnostic performance of functional flow reserve derived from CT as compared to invasively measured FFR," Min said.
Based on the medical literature, the authors assumed a diagnostic accuracy of 49% for detecting FFR ischemia. The group calculated sample size from 150 vessels in 109 patients to obtain 90% power to detect an improvement in diagnostic accuracy greater than 25% for noninvasive FFR. Inclusion criteria included a lesion larger than 2 mm in diameter in a great artery imaged on an MDCT scanner with a minimum of 64 detector rows.
Patients had to be hemodynamically stable, have an ejection fraction greater than 40, and not have other contraindications to CCTA. Obstructive coronary artery disease was defined as 50% or greater diameter stenosis, and lesion-specific ischemia was defined as FFR of 0.80 or less, Min said.
"Importantly, CCTA was read in a blinded fashion by a core lab, and FFR-CT was also calculated in a blinded fashion from typically acquired CT scans in a core lab," Min said.
Comparing the diagnostic performance of FFR versus CCTA in terms of true-negative, false-positive, false-negative, and true-positive results showed that modifying the CCTA results by defining lesion-specific ischemia as FFR ≤ 0.80 adjusts the data points at CT to correspond closely with those of angiography. "That means we're getting rid of false positives in those anatomic stenoses that we think are high-grade but that don't actually result in lesion-specific ischemia," Min said.
 |
FFR reduced CCTA's false-positive rate by 70%, which correlates to an increase in diagnostic accuracy of 26% in the per-patient analysis, with similar per-lesion results at 25% improvement, Min reported. Specificity was also poor at CCTA but increased dramatically with FFR-CT.
 |
 |
Similarly, a receiver operator characteristics (ROC) analysis showed a dramatic improvement in CT's power to discriminate ischemic lesions, and an improvement in the area under the curve from 0.770 to 0.90 with significant p-values, both per vessel and per patient, Min said.
 |
"FFR derived from CT is a novel, noninvasive method that enables physiologic assessment of coronary artery disease from coronary CTA without any additional imaging or administration of any additional medications," Min said. The multicenter DISCOVER-FLOW study "demonstrated that FFR-CT has excellent correlation to invasive measured fractional flow reserve, and that FFR-CT is superior to CT stenosis for the diagnosis of lesion-specific ischemia, with a threefold reduction in false positives and a twofold increase in true negatives."
A new prospective study -- Determination of Fractional Flow Reserve by Anatomic Computed Tomographic Angiography (DeFACTO) -- was completed in June, and will help establish the per-patient diagnostic performance of CT-based FFR, he said.
"FFR may present a one-stop shop for combined anatomic as well as physiologic imaging through performance of a single test," Min said.