By measuring changes in blood flow through the coronary arteries, German researchers succeeded in correlating functional stenosis severity results with 64-detector-row coronary CT angiography (CTA) and invasive angiography. The proof-of-concept study found that 64-detector-row CT had sufficient temporal resolution to measure blood flow through the heart, offering the promise of a new functional test based on CT alone.
Radiologists from the University of Cologne aimed to determine whether a 64-slice CT scanner allows accurate measurement of CT changes in coronary artery flow profiles. They also sought to determine if CT flow measurements were reliable enough to classify the significance and hemodynamic relevance of stenosis as a functional parameter for morphological stenosis analysis.
By itself, coronary CTA does an excellent job of detecting coronary artery stenosis, said lead investigator Dr. Henning Bovenschulte in a presentation at the 2009 RSNA meeting in Chicago.
"But we also know we have difficulty sometimes with the correct stenosis grading, particularly in cases of heavy calcification," he said. The landmark CORE 64 study, for example, excludes 22% of patients from analysis for coronary artery calcifications (New England Journal of Medicine, November 27, 2008, Vol. 359:22, pp. 2324-2336).
 |
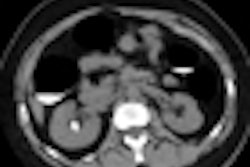
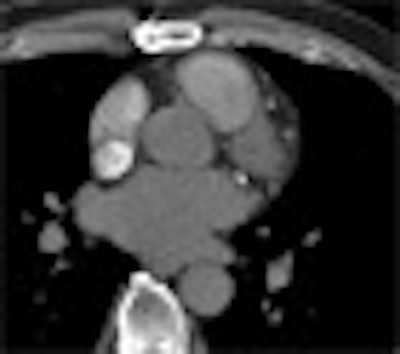
| CTA interpretation is complicated by heavy coronary artery calcification; flow analysis could potentially aid diagnosis in such cases. All images courtesy of Dr. Henning Bovenschulte. |
"With this functional investigation of the coronary arteries based on the indirect measurement of blood flow at CT, we tried to detect stenotic changes in CT and compare it with the grade of stenosis in coronary angiography," Bovenschulte explained in his presentation.
The mechanism offers an inviting research target inasmuch as contrast flow in the coronary arteries offers a locally constant, cyclical measure of cardiac blood flow (Rofo, March 18, 2009, Vol. 181:3, pp. 220-229).
"We obtain a time-density curve by bolus tracking in this model ... and we try to detect changes in this time-density curve profile in the coronary arteries compared to the curve in the aorta -- so the aorta serves as a sort of internal reference point," Bovenschulte said. The next step is gauging the degree of changes based on changes in the curve.
Bovenschulte, along with Barbara Krug, Dr. Klaus Lackner, and colleagues, prospectively examined 50 patients who underwent coronary CTA using ECG-gated 64-detector-row CT (Brilliance 64, Philips Healthcare, Andover, MA) within 24 hours of invasive coronary angiography. The heart was scanned following injection of 50 mL of contrast media at 4 mL/sec at 120 kV, 50 mAs, pitch of 0, and 420-msec rotation time.
|
|
| Video demonstrates ECG-gated continuous cyclical measurement during passage of the contrast agent through the heart at coronary CTA. A region of interest in the vessel of interest (aorta, coronary artery) generates the time-density curve. Images courtesy of Dr. Hemming Bovenschulte. |
| Having trouble viewing this clip? Click here to view full size clip or to change format. |
Two radiologists read all the images to detect any segments with morphology that was poorly evaluable with coronary CTA. They acquired a locally constant cyclical measurement in the proximal or middle third of these coronary arteries in a breath-hold technique during the passage of a 50-mL bolus of contrast media. The 25-second breath-hold was not always easy to teach to patients, Bovenschulte said.
Time-thickness curves based on the bolus flow were detected in the coronary arteries and aorta. Upslopes of the curve measuring lumen thickness were determined and correlated with each other. The radiologists then graded the diagnostic image quality of each segment, rating them by consensus and comparing the results to invasive coronary angiography. Slope ratios below 0.5 corresponded to 70% stenosis at angiography and CTA, Bovenschulte said.
In all, CT flow measurements were evaluable in 47 of the 50 patients. The researchers found good correlation between the degrees of stenosis and slope ratios in the aorta and right coronary artery (R2 = 92%). The threshold range was 55% to 77% for distinguishing hemodynamically (≥ 70% luminal narrowing) relevant from nonrelevant stenosis.
 |
| Above, cyclical local constant measurement of the coronary artery (CA) and aorta (Ao) during the passage of a contrast media bolus can be demonstrated with a time-density curve, as recently validated in a porcine model by Krug et al. Charts below show significant differences in slope values associated with coronary artery stenosis: no stenosis (below) and 80% stenosis (bottom). |
 |
 |
Most important, the CT flow measurements agreed with invasive coronary angiography findings in the coronary segments not evaluable by coronary CTA because of extremely poor image quality.
 |
| Chart shows good correlation between the grade of stenosis at invasive coronary angiography (ICA) with CT flow measurement (CTFM) gauging contrast media flow through the heart. |
CTA was well correlated to the angiographically determined degree of stenosis, Bovenschulte concluded. Once confirmed in further studies, the technique could potentially improve the diagnostic accuracy of coronary CTA without the addition of an invasive exam.
The new technique is sensitive to motion artifacts and "not recommended to use in daily clinical work yet, but it might be possible to supplement CT in cases of heavy calcification ... adding 4-5 mSv of additional exposure," Bovenschulte said. The preliminary study demonstrates that "CT scans of 64 slices have sufficient temporal resolution" to study blood flow in the arteries, he said.
By Eric Barnes
AuntMinnie.com staff writer
February 26, 2010
Related Reading
One-stop cardiac assessment evolves with dual-source CT, February 10, 2010
Study to compare 320-row CT perfusion against SPECT, February 10, 2010
MRI, MDCT err in estimating cardiac functional parameters, February 20, 2009
Adenosine stress DECT equivalent to SPECT, MRI, November 21, 2008
Study correlates CTA to angiography, myocardial perfusion SPECT, May 25, 2007
Copyright © 2010 AuntMinnie.com