In the course of a few short years, the rapid advancement of computer-aided detection (CAD) software has ensured its place in the future of virtual colonoscopy.
Sophisticated 3D image processing, analysis, and display techniques have all contributed to the mainstreaming of CAD for virtual colonoscopy (VC or CT colonography [CTC]). The current crop of CAD schemes, mostly investigational but a few on the market, do their job. That is, most yield acceptably high sensitivity for detecting colorectal polyps, combined with relatively low false-positive rates after a separate automated analysis of each polyp candidate to reduce the number of false positives.
But there's the rub. When VC CAD software is set to achieve maximum sensitivity for polyp detection, it also tends to output large numbers of false positives, which must then be eliminated in a separate and time-consuming step. When sensitivity is set too low, true positives are missed, so that's no solution either.
A new method aims to speed up CAD processing by determining from the start which polyps are likely to be deemed false positives, then eliminating them from further analysis.
"In CTC and CAD, many polyps are relatively easy to detect as long as they have the described polyp-like shapes," said Janne Näppi, Ph.D., from Massachusetts General Hospital in Boston. "But when we try to detect more than 80% to 90% of the polyps in general, then the number of false-positive detections tends to increase."
By how much? Last year Näppi and colleagues examined 28 patients with a total of 42 colonoscopically proven polyps 6 mm or larger. Increasing CAD sensitivity from 80% to 100% boosted initial polyp detections from 3,000 to 16,000, with a corresponding increase in processing time, he said.
Shape is the most important criterion CAD uses to pick out polyp candidates, he explained, and the problem is that lots of different structures that aren't polyps have vaguely polyp-like shapes at CT. So when CAD sensitivity is set high, it tends to output quite unlikely polyp candidates that turn out to represent normal structures such as haustral folds or bits of bowel wall.
To address the abundance of polyp candidates, Näppi and his colleagues Dr. Hiroyuki Yoshida and Wenli Cai, Ph.D., from Massachusetts General Hospital, along with Dr. Philip LeFere from Stedelijk Ziekenhuis in Roeselare, Belgium, developed and tested an optimized target ranking (OTR) system designed to minimize the initial detections of a traditional VC CAD system.
Producing "a large number of initial detections has some potential harm," Näppi said in his presentation at the 2007 Computer Assisted Radiology and Surgery (CARS) meeting in Berlin. The skewed distribution of a few true positives among many false positives "can degrade the performance of the statistical classifiers that are used to reduce false-positive detections," he said. It can significantly increase computation time as well, because false-positive reduction often requires several steps.
"If the whole process takes more than a few seconds for each polyp candidate, then the analysis can end up taking several hours per patient," Näppi said.
Optimized target ranking
The new method integrates the concepts of polyp candidate ranking and supine-prone correspondence into an OTR scheme that minimizes the number of false-positive detections that must later be analyzed.
"The conventional (CAD) approach is to consider some number of the highest-ranking detections, based on some size ranking and feature analysis of detections, and then discard the remaining polyp detections," Näppi said. But this method seemed arbitrary, and not optimal for decision-making, he said.
So instead of subjecting all the detections to false-positive reduction, the researchers used a Bayesian probability model to winnow the number of CAD detections that would then be subjected to the false-positive reduction process.
The OTR classifier for this function was trained using a training database of 71 clinical VC cases with polyps, including a total of 74 colonoscopy-confirmed polyps 6 mm or larger (n = 41, 6-9 mm; n = 33, ≥ 10 mm). Thirty-nine of the patients had standard cathartic bowel cleansing, and 32 underwent a reduced laxative preparation, Näppi said.
The 71 clinical cases were used to determine "the optimal features for which the Bayesian polyp likelihood should be calculated, and the optimal likelihood and rank threshold parameters for each feature and feature combination," Näppi explained.
The OTR methods then "selected the most promising candidates based on the available information for those detections using a systematic optimization scheme," he said. Two separate versions of the OTR method were applied to the study: OTR1 and OTR2.
"The OTR1 method excludes detections with lowest likelihoods, and the OTR2 method not only excludes detections with highest likelihoods, but also those with lowest ranks," Näppi said.
OTR analysis begins with hysteresis thresholding of shape and curvedness features from initial CAD detections, which are collected into a single pool of polyp candidates.
"We used precalculated information from previous CAD steps in order to have a very fast speed for this ranking," Näppi said. Detections that did not qualify for inclusion in OTR1 or OTR2 were excluded from further analysis. Because a low false-positive rate will likely be needed for the application of CAD in the clinical setting, the group limited their evaluation of ranking scheme effects to a range of only one to three false positives per patient, he said.
To keep computational overhead from the application of either OTR method down to a few seconds' time in the CAD system, only by-voxel features that had already been calculated by the previous CAD steps (Colon Extraction: CT attenuation and its gradient; Detection of Polyp Candidate Sites: volumetric shape index and curvedness) were considered, Näppi explained in an e-mail to AuntMinnie.com.
From these features, nine potential polyp candidate features were derived, including size, mean and variance of CT attenuation value, gradient of CT attenuation value, volumetric shape index, and volumetric curvedness.
All combinations of the five features above were evaluated with the 71 polyp cases. "For each combination, we determined the maximum classifier likelihood P and the lowest likelihood-based polyp candidate rank R that yielded 100% sensitivity for initially detected polyps in the training database," the researchers wrote in an abstract. "Next we determined the feature combination that minimized the number of initial CAD detections in the training database in this manner."
"One good reason to limit the number and complexity of discriminative features is to minimize overfitting to the training data. Although you could get excellent results with a large number of features or with more complicated features for your particular study, your result might not generalize well to other populations unless the new data are very similar to the training data or simply easy to analyze," Näppi said.
Once the OTR method was established, actual testing of optimized OTR was performed on the group's fully developed CAD system that uses a conventional by-feature ranking method. Initially trained with 146 cases from three institutions, the CAD system was tested on 450 different clinical cases for the study.
 |
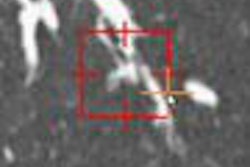
| The principle of the optimal target ranking scheme. After hysteresis thresholding based on the shape index and curvedness features, the initial polyp detections from the CT scans of a patient are combined into a single pool of detections, and a Bayesian probability model is used to determine the actual detections, which are then subjected to the false-positive reduction steps in the CAD scheme. All images courtesy of Janne Näppi, Ph.D. |
Same accuracy faster
The mean value of shape index was the single highest-performing feature with the training data, Näppi said. The best-performing combination (which also exceeded the performance of shape index alone) included five features: size, mean value of CT attenuation, mean value of shape index, variance of curvedness, and variance of the gradient magnitude of CT attenuation.
Optimization with the training data indicates that with this feature combination and OTR2 the subsequent CAD steps would need to analyze only 43 locations per patient in CTC data (including both supine and prone CT scans) to yield potentially 100% polyp detection sensitivity.
The best feature combination for OTR1 was slightly different from that of OTR2, Näppi said. With OTR1, the best combination consisted of mean value of volumetric shape index, mean value of volumetric curvedness, variance of CT attenuation value, variance of volumetric shape index, and variance of volumetric curvedness.
"The fact that these features can provide effective discrimination between initial detections of polyps and nonpolyps is not surprising, because they had already been found to be effective in our previous study," he explained. That study evaluated the performance of multiple features for reducing the number of final displayed CAD polyp candidates by use of a statistical classifier (Academic Radiology, April 2002, Vol. 9:4, pp. 386-397).
The application of OTR1 reduced the initial CAD detections to 144 per patient on average. In comparison, "the application of OTR2 reduced the number of detections to 19,547, or 43 per patient, an 89% reduction from the original," Näppi said. Computation time was reduced accordingly. Despite having far fewer polyp candidates to evaluate, "application of the OTR system didn't affect performance," he said.
The traditional CAD's detection sensitivity was 92% for polyps 8 mm and larger, and 94% for polyps 10 mm or larger; the areas under the FROC curve were 0.79 and 0.84, respectively. When conventional by-feature ranking with the shape index feature in the conventional CAD was applied, CAD yielded a total of 176,809 polyp detections in the 450 patients, an average of 392 detections per patient, Näppi said.
 |
| Graph indicates the reduction in the number of initial detections for the 450 CT colonography test cases when the optimal target ranking schemes were integrated in the CAD system. For 100% by-polyp detection sensitivity, the average number of initial detections per patient was reduced from 392 detections in the conventional CAD scheme down to 144 detections in the OTR1 scheme and 43 detections in OTR2 without loss of detection accuracy. |
OTR integrated into a traditional CAD application minimizes the number of polyp candidates that require analysis by false-positive reduction, Näppi said. Sensitivity was identical to that produced by the traditional CAD system -- but with only 11% as many polyp candidates to evaluate. Thus, optimized target ranking could potentially increase CAD throughput significantly, without any degradation in detection performance, he concluded.
By Eric Barnes
AuntMinnie.com staff writer
October 1, 2007
Related Reading
Fully automated VC CAD system solves tagging problems, June 25, 2007
VC CAD ramps up detection of medium-sized polyps, March 12, 2007
CAD will be key to VC screening, September 13, 2006
VC CAD improves results for readers at all levels, April 7, 2006
CAD aids polyp detection in 64-slice study, May 12, 2006
Copyright © 2007 AuntMinnie.com