Structural MRI volumetric analysis of gray matter in the brain can predict a subsequent decline in IQ in children with sickle cell disease, according to a team from the University of Maryland School of Medicine.
The researchers found that features measured on structural MRI baseline scans could accurately predict future declines in scores on the Kaufman Brief Intelligence Test (KBIT) in low-risk children with sickle cell disease. Prognostic models using these variables yielded 84% accuracy, 78% sensitivity, and 86% specificity for a decline in IQ, as measured via the KBIT scores.
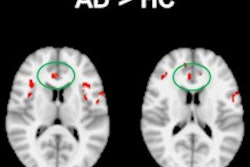
"The lower baseline volumes of the right middle occipital gyrus, the left inferior occipital gyrus, and the right fusiform gyrus were predictive of KBIT decline," said Rong Chen, PhD. He presented the findings at the recent RSNA 2013 conference in Chicago.
Predicting IQ declines
Sickle cell disease is the most common single-gene disorder in African-Americans, and children with the disease are at high risk of cognitive impairment. A reliable determination of the risk of cognitive decline is needed, as these children may benefit from preventive measures if they are implemented early, Chen said.
Research has consistently linked stroke with severe neurocognitive impairment in children with sickle cell disease, but even those who have never had symptomatic cerebrovascular accidents and who are in a low-risk category for stroke still suffer from neurocognitive deficits and lower IQs, he said.
As a result, the researchers sought to build a predictive model for children with sickle cell disease who are at low risk for stroke to differentiate those who would be expected to have an IQ decline from those who would not, based on baseline structural MRI volumetric analysis.
The researchers gathered a study population of 25 children with sickle cell disease from the Sickle Cell Center at the Children's Hospital of Philadelphia. Patients were included if they had a sickle cell anemia genotype of homozygous hemoglobin S, no deficits on neurological examination, no history of stroke, and transcranial Doppler mean velocities less than 170 cm/sec on a routine screening ultrasound examination.
Exclusion criteria included history of a major head injury requiring a visit to an emergency department, history of a seizure disorder requiring anticonvulsant therapy, and chronic transfusion therapy. Subjects were also excluded for occurrence of a sickle cell anemia pain episode, acute chest syndrome, or other significant medical problems in the period between laboratory blood testing, neuropsychological testing, and sonographic studies. The researchers also excluded those with a history of prenatal or perinatal hypoxic-ischemic brain injury and those with evidence of HIV infection.
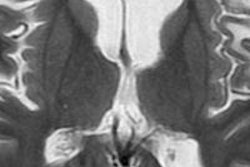
MRI was performed within 30 days of the baseline KBIT evaluation and included T1-weighted, T2-weighted, and fluid-attenuated inversion recovery (FLAIR) sequences. MR image analysis involved a skull-stripping technique and a joint segmentation and registration process. Automatic volume calculations were then performed using the freeware Individual Brain Atlases Using Statistical Parametric Mapping (IBASPM) software.
Each individual brain was parceled into 90 structures defined in the Automated Anatomical Labeling (AAL) brain template atlas. The researchers then calculated total gray-matter volume, total white-matter volume, total brain volume (the sum of gray matter and white matter volumes), and regional gray-matter volumes (measured in cubic millimeters for the 90 AAL structures.)
The researchers also evaluated another variable, silent infarcts, which were defined as an abnormal hyperintensity on FLAIR images that was at least 3 mm in diameter and visible in at least two perpendicular planes, Chen said.
Each child was again given the KBIT exam on yearly intervals from two to four years after baseline testing. The rate of change in KBIT was the primary outcome measure in the study.
Building a predictive model
To create a predictive model for whether a child would experience a decline in KBIT scores, the researchers extracted candidate markers to predict decline, including features extracted from MR images as well as demographic and socioeconomic variables.
The overall mean rate of change in KBIT scores was 1.27 (standard deviation = 4.6), which was fairly stable, Chen said. Of the 25 children in the cohort, nine had a KBIT score decline and 16 did not.
The mean rate of change in the decline group was -4.94 (standard deviation = 1.08), compared with 2.82 (standard deviation = 3.79) in the group that didn't decline. The difference in mean rate of change was statistically significant (p < 0.001).
Lower baseline volumes of the right middle occipital gyrus, the left inferior occipital gyrus, and the right fusiform gyrus were predictive of KBIT decline, and prognostic models created using these variables yielded 84% accuracy, 78% sensitivity, and 86% specificity for KBIT decline.
The researchers noted that the decline group was characterized by a higher severity of baseline disease. Children in the decline group had smaller gray-matter volumes in five out of six selected brain regions, and those in the decline group had higher silent infarct proportions.
The three brain structures that were predictive of KBIT decline are also included in the parieto-frontal integration theory of intelligence, Chen also noted.