Years of supersizing have left the world -- and Americans in particular -- feeling fat and sassy. While many people turn to Dr. Atkins or Dr. Agatston (The South Beach Diet) to help them slim down, others are taking more drastic measures such as gastric-bypass surgery or gastric banding.
According to a presentation at the 2004 European Congress on Obesity in Prague, as many as 50,000 downsizing procedures are performed annually in Europe and the U.S., estimated Dr. Martin Fried of the Laparoscopic-Obesity Treatment Hospital in Prague.
But there's still a fair segment of the population that isn't willing to give up French fries and other tasty saturated fats. The latest figures from the Centers for Disease Control and Prevention indicate that 31% of American adults, and 17% of adolescents, tip their scales (Journal of the American Medical Association, June 16, 2004, Vol. 291:23, pp. 2847-2850).
Unfortunately, excess body weight has been linked to a number of serious health complications, such as obesity, Type 2 diabetes, and a menu of cancers, including breast, colon, prostate, and ovarian.
It's a safe bet that imaging specialists are going to have to contend with these heavier patients at some point. Two recent papers focused on the role of weight-related imaging: An MRI study demonstrated how the modality can be used to quantify skeletal muscle lipid concentrations in obese subjects. The second piece of research looked at the impact of patient weight on PET/CT scan time, quality, and cancer detection.
MR for lipid concentrations
The accumulation of fat within the skeletal muscles can offer clinicians information on metabolic dysregulation and muscle function. What's currently lacking is a way to accurately assess muscle lipids, and determine whether this trend can be reversed by diet and exercise, especially in obese patients, wrote Dr. Bret Goodpaster and colleagues from the University of Pittsburgh Medical Center and Queen's University in Kingston, Ontario, Canada.
"This study demonstrates that MRI can be employed to map the three-dimensional distribution of tissue lipid content over a selected volume of the lower leg in a rapid and quantitative fashion," wrote Goodpaster, who is from the department of medicine. Co-authors included radiologists Drs. V. Andrew Stenger, Fernando Boada, and Denise Davis (American Journal of Clinical Nutrition, May 2004, Vol. 79:5, pp. 748-754).
For this study, 45-minute MRI scans of the lower leg were performed in 11 women and five men on a 3-tesla Signa scanner (GE Healthcare, Waukesha, WI). An existing 1.5-tesla extremity coil was rebuilt into a quadrature radiofrequency extremity coil.
The body mass index (BMI) for the obese subjects ranged from 30-37; for the normal-weight subjects, the BMI ranged from 18-24. They were imaged in a supine position with the right leg placed in the extremity coil.
  |
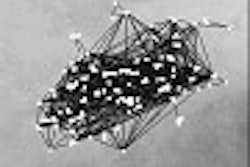
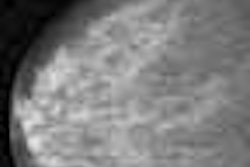
| A: Fat-selective MRI of the lower leg obtained by using spiral sequences and echo time of 5 ms. Lipid phantoms are visible near the top of the image. B: Histogram of pixel signal intensity covered by the dashed line in panel A across the image from left to right. Note the high lipid signal intensity in subcutaneous adipose tissue (1) and the relatively higher concentration of lipid within skeletal muscle on the right side of the image. Also note that the spike between 2 and 3 represents a section of the fatty septa (intermuscular adipose tissue), which is a potential confounder of muscle lipid content if regions of interest are not carefully drawn. Reproduced with permission by the American Journal of Clinical Nutrition. © Am J Clin Nutr 2004;79:748-754, Fig. 2A-B. American Society for Clinical Nutrition. |
A set of T1-weighted spin-echo sagittal images were acquired to localize phantoms and the lower limb. Another T1-weighted image was acquired to identify specific muscle groups, as well as subcutaneous and intermuscular adipose tissue. Fat-selective images were taken with a lipid phantom in every patient in order to produce lipids maps and quantify the lipid signal.
"The maps of lipid content were generated by using a spiral two-shot gradient-echo sequence to acquire images with different TEs," the authors explained. "These fat-selective images were acquired by placing a fat-suppression pulse at -440 Hz and following this pulse by a spectral-spatial radiofrequency excitation with a stop band at -440 Hz."
Data were derived based on the concentration of lipid (g/dL) within skeletal muscle and its correspondence to the mean lipid signal intensity with specific muscle groups. The p value was set at less than or equal to 0.05.
According to the results, "extremely good agreement was found between the fat signal intensity of the patients and the actual lipid concentration of standards...which were placed on the subject's leg during each scan." They found that the lipid content of the soleus (2.99 g/dL) and the medial head of the gastrocnemius (3.80 g/dL) were higher than that of the tibialis anterior (1.83 g/dL).
In addition, lipid content was more than two-fold higher (p<0.05) in the medial head of the gastrocnemius of obese subjects than in those of normal weight -- 5.48 g/dL versus 2.54 g/dL. However, there was no significant different in the tibialis anterior and soleus in both groups.
"MRI may help us to better understand the role of muscle fat accumulation in the physiology and pathophysiology of obesity, aging, and metabolic disease," the authors concluded. MRI was able to detect interindividual differences in muscle lipid content, as well as quantify fat deposits, particularly in overweight subjects.
They credited the use of a shorter TE in their acquisition scheme for providing a stronger lipid signal than the TE used in previous studies. Also, a longer TR helped achieve T1 saturation.
The group acknowledged that its study had two limitations: a significant degree of technical expertise was required to work with this MR sequence. Also, future studies will have to determine if this type of imaging can be done on a low-field scanner.
Weighing time against quality in PET/CT
In another study, a group from the University of California, Los Angeles set out to determine if fast weight-based PET/CT imaging protocols could be established without compromising lesion detectability. The researchers shared their results in the Journal of Nuclear Medicine.
The study population consisted of 57 cancer patients (lung, lymphoma, breast) who underwent PET/CT exams for staging or restaging. The patients were split into three groups based on their weight:
- Category 1: <130 lb.
- Category 2: 130-179 lb.
- Category 3: >180 lb.
Patients were also categorized according to their BMI, with an index of more than 25 and less than 30 indicating overweight, and more than 30 indicating obese.
Three-dimensional imaging was done on a Reveal RT PET/CT scanner (CPS Innovations, Knoxville, TN). The PET component of the system consisted of three rings with a total of 144 LSO detectors. The CT part was a conventional helical scanner.
Patients fasted for at least six hours before the exam, which was started one hour after IV injection of 7.77 MBq of 18F-FDG per kg. They were positioned with their arms up and instructed to use shallow breathing. An 80-110 second whole-body CT acquisition was done.
 |
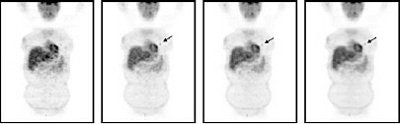
| Patient (46-year-old; weight 160 lb) with non-small cell lung cancer. Small focus of increased uptake corresponded to 1.3-cm primary lung cancer. On prospective evaluation, this lesion had been missed on one-minute/bed position images. Reprinted by permission of the Society of Nuclear Medicine from: Halpern BS, et al, Impact of Patient Weight and Emission Scan Duration During on PET/CT Image Quality and Lesion Detectability. J Nucl Med 2004;45:791-801, p.800, Fig. 2. |
Three experienced nuclear medicine physicians identified the lesions and graded the image quality as good, moderate, poor, or non-diagnostic. The relationship between acquisition time and image quality was evaluated with a generalized estimating equations (GEE) model.
A total of 114 hypermetabolic lesions were identified, with the majority (63%) in the chest. "Twenty-eight lesions were identified in weight category 1, 75 in category 2, and 11 in category 3," the authors said. "When classified by body mass index, 17 lesions occurred in underweight patients, 40 in the normal weight group, 46 in overweight patients, and 11 in obese patients" (JNM, May 2004, Vol. 45:5, pp. 797-801).
They found that one-minute/bed position emission scans were fine for detecting lesions in patients in Category 1, while two-minute/bed position emission scans were sufficient across all weight groups. However, "because four lesions were missed on one-min/bed position scans, such short scan durations should not be used in patients with higher weights," they said.
With regard to image quality, the interpreters' concordance was good, with only 87 out of 220 images considered poor and one deemed non-diagnostic.
They concluded that 35 minutes was the maximum imaging time in patients who weighed more than 250 lb. In patients who weighed less than 130 lb, PET/CT scans were obtained within eight minutes. By implementing this weight-based PET/CT protocol at their institution, the authors said they have studied more than 2,000 patients with 14-minute scans.
By Shalmali PalAuntMinnie.com staff writer
June 30, 2004
Related Reading
Study: Most Britons unaware of obesity-cancer link, April 5, 2004
Imaging helps detect and treat bariatric surgery complications, December 12, 2003
Boning up on musculoskeletal MR basics at ISS, September 18, 2003
Single-slice MR assesses overweight youth, meaning CT could too, July 12, 2003
Gastric bypass battles bulge, but patients pose imaging challenge, March 27, 2003
Copyright © 2004 AuntMinnie.com