Everyone from radiologists to Congressional representatives is talking about the issue of medical imaging overutilization and how to cut costs. Some propose the use of radiology benefit management firms; others, including the American College of Radiology (ACR), say that establishing and implementing appropriateness criteria is a better tactic.
Dr. Chris Sistrom, from the University of Florida Health Center in Gainesville, and colleagues at Massachusetts General Hospital (MGH) in Boston evaluated the effect that certain appropriateness criteria measures, particularly a computerized radiology order entry (ROE) and decision-support (DS) system, have on the growth rates of outpatient CT, MRI, and ultrasonography procedures over time. The study findings will be published in an upcoming issue of Radiology (April 2009, Vol. 251:1, pp. 1-9).
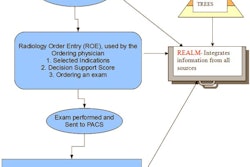
The team used a Web-based ROE system that allowed referring physicians to request and schedule outpatient diagnostic imaging studies. The system was introduced at MGH in 2001 and was gradually incorporated for outpatient clinical use through 2003. Before the ROE system was in place, studies were ordered using paper, fax, and telephone.
The decision-support component was added in the fourth quarter of 2004 and applied to orders for MRI, CT, and nuclear cardiology studies. The software provides an appropriateness score of 1-9 at the time the clinician orders the study, with scores based on the ACR's Appropriateness Criteria, as well as indication and procedure pairs developed in-house by a consensus panel of radiologists, primary care physicians, and specialist clinicians.
When a clinician orders a study through the ROE program, the software offers feedback rating the appropriateness of the order in a series of nine color-coded boxes: red (score 1-3, low utility), yellow (score 4-6, marginal utility), and green (score 7-9, clinically indicated). Alternative exams are also shown for comparison.
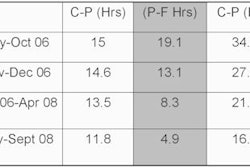
Based on a statistical analysis of data accumulated between October and December 2007, Sistrom's team found that use of the ROE and DS system led to a substantial decrease in the growth rate of high-cost imaging studies (MR, CT, and ultrasound). Even as outpatient visits increased at a compound annual growth rate of nearly 5%, the annual outpatient CT growth rate decreased from 12% before use of ROE/DS to 1% with use, and MR imaging and ultrasound annual growth rates each decreased by five percentage points, from 12% to 7% and 9% to 4%, respectively.
"The most impressive change occurred for CT, in which the growth rate (and absolute quarterly increase) after ROE and DS system implementation was essentially flat," the authors wrote.
 |
| Scatterplot of outpatient CT exam volumes (y-axis) per calendar quarter (x-axis) represented by red diamonds. Solid line represents linear component of the piecewise regression with break point at the fourth quarter of 2004 and accounting for outpatient visit volume. Dashed line shows projected linear growth without implementation of ROE and DS system. Dotted line and teal circles depict number of CT exams ordered through computer order entry. Appropriateness feedback was started in the fourth quarter of 2004 and continued through the duration of the study (arrow at lower right). All images courtesy of the Radiological Society of North America. |
 |
| Scatterplot of outpatient MRI exam volumes (y-axis) per calendar quarter (x-axis) represented by red diamonds. Solid line represents linear component of the piecewise regression with break point at the fourth quarter of 2004 and accounting for outpatient visit volume. Dashed line shows projected linear growth without implementation of ROE and DS system. Dotted line and teal circles depict number of MRI exams ordered through computer order entry. Appropriateness feedback was started in the fourth quarter of 2004 and continued through the duration of the study (arrow at lower right). |
 |
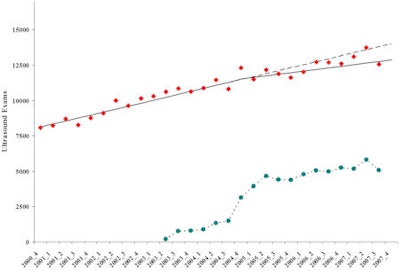
| Scatterplot of outpatient ultrasound exam volumes (y-axis) per calendar quarter (x-axis) represented by red diamonds. Solid line represents linear component of the piecewise regression with break point at the fourth quarter of 2004 and accounting for outpatient visit volume. Dashed line shows projected linear growth without implementation of ROE. Dotted line and teal circles depict number of ultrasound examinations ordered through computer order entry. |
Sistrom and colleagues believe that the study results are attributable to two factors: the "gatekeeper effect," which is the fact that a new and sometimes more difficult set of steps are required to order, schedule, or authorize an imaging exam (the ROE system); and the "educational effect," which is the way a new ordering process changes practice patterns and provides educational feedback.
The study demonstrates substantial decreases in the growth rate of outpatient CT, MR, and ultrasound exam volume, despite continued steady growth in outpatient visit activity, the researchers concluded.
By Kate Madden Yee
AuntMinnie.com staff writer
March 24, 2009
Related Reading
Web-based workflow and reporting systems keep imaging on track, March 10, 2005
Web-based application nets teleradiology benefits, January 31, 2005
Security in the wired or wireless world: users are the weakest link, May 24, 2004
'Safety net' system stops patients from falling into follow-up black hole, May 5, 2004
Copyright © 2009 AuntMinnie.com