Canadian researchers are using CT to assess the severity of bronchiolitis obliterans syndrome (BOS), the most common cause of late death among lung transplant patients. In preliminary experiments, CT attenuation data corresponded to disease severity.
A related study at the same institution found that high-resolution MDCT beat conventional high-resolution CT (HRCT) in detecting and characterizing BOS.
In lung transplant patients, BOS describes the chronic rejection of the lung allograft via a fibrosing process that progressively affects the conducting airways. Over time, irreversible eosinophilic scarring of the terminal and respiratory bronchioles may develop progressively, partially or completely. In severe cases BOS can obliterate the airway lumen and result in death.
Immunologic activity is believed to cause most BOS-associated scarring, but its development and progression are also associated with other specific lung tissue injuries and pathogens (in transplant patients and others), such as the presence of cytomegalovirus.
Whatever the etiology in the individual patient, however, there is a critical need to develop better tests to grade the degree of airway inflammation and airway damage, both to aid diagnosis and develop better treatment options.
At the 2005 RSNA meeting in Chicago, Dr. Harvey Coxson, Ph.D., an assistant professor of radiology at the University of British Columbia in Vancouver and a radiologist at Vancouver Hospital, discussed his group's work to quantify airway damage and correlate it with BOS severity.
"Bronchiolitis obliterans affects more than 50% of patients five years post-transplantation, and 40% of these affected patients die within two years of the initial diagnosis," Coxson said. "There is a need to identify BOS before irreversible airflow obstruction occurs, and possibly new treatments can be derived that will save these people from death."
BOS is a clinical survey of chronic allographic rejection, measured using spirometry compared to a baseline measurement at the time of transplantation, Coxson said. But although spirometry can identify the presence of established BOS, it has not been shown to detect early-stage disease, when it is thought that early intervention could be helpful.
The study sought to quantify gas trapping in the presence of postlung transplant bronchiolitis obliterans using computed tomography (CT) scans.
"The hypothesis is that CT can quantify changes caused by gas trapping in the presence of postlung transplant BOS," he said.
Coxson, along with Claudine Storness-Bliss, Pim de Jong, Robert Levy, and Dr. John Mayo, examined 48 patients (26 male and 22 female, ages 18-68) who had undergone lung transplantation (eight left, 20 right, 20 double). The patients' mean forced expiratory volume expressed as a percentage of post-transplant value was 79% (range of 34% to 101%). Mean forced expiratory flow was 58% (range of 9% to 110%).
Patients were divided into categories of airflow obstruction severity using the International Society of Heart and Lung Transplantation BOS stages: BOS 0 (no airflow obstruction on spirometry, n = 10), BOS 0P (beginning stages, n = 17), BOS 1 (mild obstruction, n = 12), BOS 2 (moderate obstruction, n = 5), and BOS 3 (severe obstruction, n = 4).
CT scans were acquired on either LightSpeed (GE Healthcare, Chalfont St. Giles, U.K.) or Sensation 16 (Siemens Medical Solutions, Malvern, PA) multidetector-row scanners. Depending on the scanner, the inspiratory acquisition used 1- or 1.25-mm collimation, with a 10-mm gap or contiguous. The expiratory protocol used 1- or 1.25-mm slices, with either a 20-mm gap or contiguous. All images were reconstructed using a high-spatial-frequency reconstruction algorithm, Coxson said.
"The x-ray attenuation values within the lung were analyzed using special software we've developed that separates lung (CT data) from the surrounding chest wall and mediastinal structures," he said.
The HU-based attenuation measurement was converted (HU + 1,000/1,000) to a measurement of CT density, and further converted into a measurement of lung inflation in milliliters of gas per gram of tissue (mL gas/g tissue) "by taking the inverse of the CT density and subtracting the inverse of the tissue density (1.065 g/mL)," Coxson said. Then lung capacity was estimated using predicted total lung capacity per patient divided by a published lung weight equation.
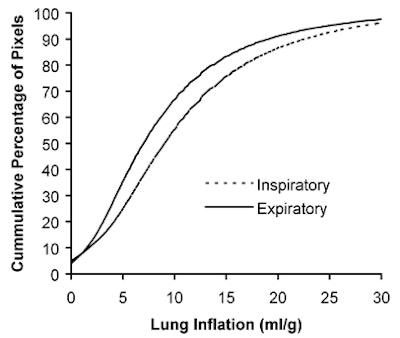
A slide based on these calculations showed a visible grayscale difference between inspiration and expiration in BOS 0 patients that was not present in BOS 3 patients. Compared to the BOS 0 group, BOS 3 patients showed "a shift in both the inspiration and expiration curve -- especially on expiration there is much less of the lung below this maximum cutoff value," he said.
 |
| These figures chart a cumulative frequency distribution of lung inflation during inspiration (dotted line) and expiration (solid line). The figure above shows a subject with no airflow obstruction due to bronchiolitis obliterans (BOS stage 0). The figure below shows a subject with severe airflow obstruction (BOS stage 3). In the BOS 0 subject above, there is a large difference between the inspiratory and expiratory curves indicating that the lung was able to empty on expiration. The BOS 3 subject below shows that both the inspiratory and expiratory curves are shifted to a high lung inflation value, and there is less difference between the curves, suggesting that there is gas trapping the occurring on expiration. The difference between these two curves is the measure of gas trapping that is occurring in more severe stages of airflow obstruction. Charts courtesy of Harvey Coxson, Ph.D. |
 |
To quantify the gas trapping, the group used cumulative frequency distribution curves that measured lung inflation from the CT data. The proportion of the expiratory CT scan voxels with an inflation value less than predicted maximal lung expansion (MLE, in mL gas/g tissue) was divided by the proportion of the inspiratory CT voxels with an inflation value less than the MLE. Logistic regression analysis was then used to model the association between proportion of lung voxels inflated below MLE on the expiration and inspiration CT scans.
"When we plot this against BOS stages, and we plotted the log of the odds ratio, there's a significant association" between the expiration/inspiration ratio and disease stage (p < 0.001), Coxson said.
In BOS stage 0, the expiration/inspiration ratio of CT inflation below MLE was 4.19 (95% confidence interval (CI): 4.19, 4.20). As airflow limitation worsened, the ratio was 3.69 (CI: 3.68, 3.70) in BOS 1 and 3.49 (CI: 3.47, 3.50) in BOS 2-3.
Thus, BOS severity is associated with changes in quantitative CT measurements of gas trapping assessed by means of an odds ratio, the group concluded.
"We believe this technique holds promise for the early detection of bronchiolitis obliterans before the development of irreversible pulmonary function abnormalities," Coxson said.
MDCT beats HRCT
Another RSNA study, presented by Dr. Jonathan Dodd from the same facility, compared high-resolution MDCT to conventional HRCT in detecting BOS in lung transplant patients. According to the abstract, 24 lung transplant recipients underwent 16-slice MDCT as part of an annual assessment.
"Eight image sets were reconstructed from 1-mm contiguous MDCT slices: transverse/sagittal/coronal sections in inspiration and expiration; inspiratory HRCT (1-mm slices every 10 mm) and expiratory HRCT (1-mm slices at three selected levels) derived from the MDCT image sets," the authors wrote.
Two experienced readers working independently read the images, randomly scoring for bronchiectasis, mucus plugging, air wall thickening, mosaic perfusion, and air trapping on a scale of 0-5.
No significant differences were found between the image sets (transverse: 15.5 ± 15, sagittal: 13.4 ± 13, coronal: 13.0 ± 9, and HRCT: 14.4 ± 15), but on average MDCT detected more structural abnormalities, the authors wrote.
In 198 lobes, MDCT detected "1.5 more with central and eight with peripheral bronchiectasis, 2.5 more with central and one with peripheral mucus plugging, 2.5 more with peripheral wall thickening, 0.5 more with mosaic perfusion, and 10 more with air trapping that were not detected with HRCT," the group wrote. MDCT correlated significantly with forced expiratory volume (R = 0.60, 0.50, 0.63, respectively, p < 0.01), but HRCT did not. And multiple regression analysis showed that MDCT was the only independent predictor of airflow obstruction (R2 = 0.42, p < 0.001).
"Sixteen-slice high-resolution MDCT detects more structural lung abnormalities than conventional HRCT, and is an independent predictor of the clinical diagnosis of BOS," Dodd and colleagues wrote.
By Eric Barnes
AuntMinnie.com staff writer
March 13, 2006
Related Reading
Newly identified coronavirus linked to severe lower respiratory tract disease, March 8, 2005
New MRI method allows visualization of distal airways, April 29. 2003
Copyright © 2006 AuntMinnie.com