Researchers from Massachusetts General Hospital in Boston have built a computer-aided detection (CAD) scheme that can find polyps in tagged virtual colonoscopy (VC, or CT colonography [CTC]) images, without getting bogged down by the oral contrast.
The result, they say, is the first such system to effectively address the myriad problems associated with fecal tagging in CT images. So-called minimal-prep virtual colonoscopy can make the exam significantly easier for patients by eliminating the unpleasantness of cathartic bowel cleansing.
The presence of fecal tagging agents, typically barium or iodinated oral agents, produces a number of technical challenges for CAD systems that attempt to segment the colon data and pick out polyp candidates.
"In this study, for addressing these problems of ftCTC (fecal-tagged CT colonography), we developed a fully automated CAD scheme for the detection of polyps," wrote Janne Näppi, Ph.D., and Hiroyuki Yoshida, Ph.D., from Massachusetts General Hospital and Harvard Medical School in Boston (Academic Radiology, March 2007, Vol. 14:3, pp. 287-299).
 |
| With laxative colon preparation (left), residual materials tend to appear only in fluid form. Fecal tagging may be used to reveal polyps covered by the residual fluid (bottom left). With nonlaxative preparation (right), fecal tagging must be used to identify residual materials that tend to appear in solid form and imitate polypoid shapes (bottom right). All images courtesy of Dr. Hiro Yoshida. |
One problem is pseudoenhancement (PEH). In noncontrast VC, polyps are expected to have soft-tissue density of 100 HU or less.
"In ftCTC, high-density tagging artificially increases the observed density of nearby materials, and pseudoenhanced polyps may demonstrate CT attenuations up to > 500 HU," the team explained. "Furthermore, the effect of the PEH varies greatly according to the amount, thickness, and radiodensity of tagged materials, and it can vary substantially even between different regions of the colon."
CT attenuation is not a reliable feature for automated identification of tagged regions in ftCTC, a serious drawback for CAD applications, they wrote.
A second problem involves the identification of shape and texture features, which is also skewed in the presence of oral tagging agents, Näppi and Yoshida wrote. Ideally, tagged regions should represent air in the colon. But because the attenuation of air is lower than soft tissue and that of tagged data higher, "soft-tissue regions covered by tagging are negative image regions as opposed to soft-tissue regions covered by air," they wrote.
These density alterations can actually change the gradient and principle curvature of local surfaces so that concave polyps can appear convex. And because the effects vary widely, it is not clear how or to what extent the shapes have changed, the researchers explained.
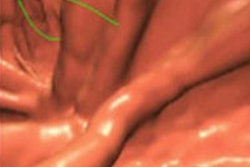
 |
| The CTC appearance of the colon can vary widely depending on the administration of laxatives and fecal tagging, as exemplified by these three images. The image on the right also demonstrates how the appearance of the colon can vary dramatically between different colon segments: here, residual feces that are tagged clearly in ascending colon are not tagged at all in descending colon. |
Finally, both tagging and PEH wreak havoc on automated extraction of the colon, a critical part of VC CAD that occurs before polyp candidates can be selected. As a result, the colon can be split into multiple disconnected components incorporating bits of small bowel or stomach data, and in the presence of tagging the thin colon walls can become invisible due to PEH, resulting in "complex networks of interconnected lumen paths" on the CT data, Näppi and Yoshida wrote. And osseous structures, which have attenuation similar to that of tagged materials, can be difficult for CAD to distinguish.
Solving problems
The ftCAD scheme solves these problems with various tools, some previously developed and some new. The problem of pseudoenhancement, resulting from x-ray scatter in highly attenuating tagged regions, is addressed by preprocessing the fecal-tagged VC data with the group's previously developed adaptive density correction (ADC) method, which normalizes the attenuation of virtual colonoscopy images via local correction of attenuation without affecting the underlying attenuation of the CT data.
After application of the ADC, the effects of tagging on shape and texture features is minimized by the use of adaptive density mapping (ADM), which permits uniform calculation of shape and feature fixtures in both tagged and untagged regions without any feature-specific adjustments, the group explained.
The first step of ADM identifies the interface regions between air and tagged materials, and distinguishes them based on density. The second step converts the resulting CT attenuations to minimize the effects of tagging by correcting the shape index values -- for example, converting concave values to convex.
Application of this process creates a ridge-like artifact, however, at the interface between air and tagged (A/T) regions.
"Because the interface A/T is typically composed of a variable mixture of air, tagged region, and soft-tissue structures such as polyps, folds, or poorly tagged residual materials, and because the interface is also affected by the PEH and partial-volume effects of these materials, it is not obvious how to reconstruct precisely the actual CT attenuations at A/T," and such errors can produce artifacts, they noted.
Any false positives that may result from these effects are avoided by identifying this A/T region and excluding these voxels from polyp detection, without changing the underlying attenuations. Once the polyp candidates are identified, this constraint on attenuation at the A/T interface is eliminated.
"Therefore, although any (false-positive) CAD detections that could originate from A/T will be excluded, the complete region of the detected polyp candidates will be extracted," Näppi et al wrote. "The polyps that are of clinical interest are ≥ 6 mm, and they are large enough to remain detectable by CAD even if they are located at A/T."
The ADC and ADM functions were optimized by the use of an anthropomorphic phantom.
Tracking the lumen
To visualize the colon data from the raw CT images, the abdominal region is extracted automatically from other anatomy by a series of thresholding, morphologic and region-growing methods, and the regions containing soft tissues, tagging, and air are selected using the ADM method. A path is then calculated automatically along the lumen, and the lumen and wall regions are extracted by means of a region-growing method whose path is calculated by distance transform, the authors explained.
If a single complete lumen path is not found -- i.e., a portion of the lumen is collapsed -- the disconnected lumen paths are reconstructed on rule-based anatomic landmarks representing the cecum, descending colon, and rectum that choose the optimal candidate path. The system then verifies the location of the ileocecal valve "to prevent the lumen path from entering the small bowel through an open valve," the group wrote. A region-growing step is used to extract the colonic lumen from the calculated path.
Previously described methods are used to detect polyp candidates based on shape and curvedness indexes, by means of hysteresis thresholding of the shape and curvedness characteristics of the data. False positives are reduced by applying a previously described Bayesian neural network-based shape and texture features calculated from polyp candidates.
Thus the broad steps of the automated process include adaptive density correction, extraction of the colon, detection of polyp candidates, extraction of polyp candidates, and reduction of false positives.
The CAD system was evaluated using two databases of 32 patients each -- one cleansed and one uncleansed, Näppi and Yoshida explained. The first set of data had full cathartic cleansing and 40 polyps ≥ 6 mm, and the second set had reduced cathartic cleansing and 44 polyps ≥ 6 mm, they wrote.
The CAD system detected 95% and 86% of the polyps ≥ 6 mm in the cleansed and uncleansed datasets, with 3.6 and 4.2 false-positives per case, respectively. For polyps ≥ 10 mm, which are considered clinically significant, the detection sensitivity was 94% in the cleansed data, with one missed benign hyperplastic polyp; and 100% in the reduced-prep database, with the same respective numbers of false positives, they reported.
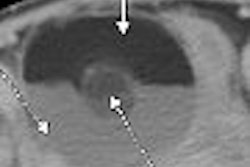
 |
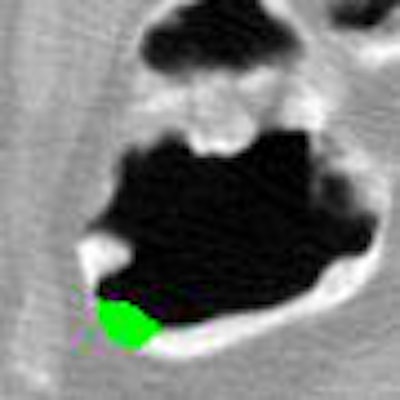
| Application of CAD to nonlaxative case. After pseudoenhancement correction (left), tagged materials can be subtracted instantly by mapping of CT attenuations higher than 100 Hounsfield units down to the level of air (middle). The resulting residual artifacts at three-material interfaces do not affect CAD, because they look different from polyps. Leaving the artifacts in place also avoids the common problem of false-positive CAD detections from artifacts that tend to be introduced by full electronic subtraction methods. On the right, the region of a 10-mm adenoma that the CAD extracted correctly from the region is colored green. |
"The detection sensitivity of ftCAD was approximately 20% higher than that of the conventional CAD scheme," in the generally well-tagged datasets, the authors wrote. The ftCAD system correctly identified most tagged regions as false-positive that were identified as polyps by the conventional CAD system, while other tagged regions were falsely identified as true polyps in both systems.
"The parameter optimization was performed by use of an anthropomorphic colon phantom and by use of clinical databases that were independent from the clinical evaluation data used in this study," they noted.
The CAD scheme produced high per-polyp detection performance with a low false-positive rate in both tagged and untagged datasets, the group concluded.
At the 2006 RSNA meeting, the group also presented CAD results for the two databases in the present study by considering only the detection of adenomatous polyps and carcinoma, when the average number of false-positive detections per scan was limited to five or fewer.
In the cathartic database, the detection sensitivity of the new ftCAD was 100% for polyps ≥ 10 mm (n = 14) and 97% for polyps ≥ 6 mm (n = 32), respectively, with 1.5 false positives per scan, whereas the conventional CAD scheme detected 93% of the ≥ 10 mm polyps and 78% of the ≥ 6mm polyps, the researchers wrote in an e-mail to AuntMinnie.com.
In the reduced cathartic prep database, the detection sensitivity of ftCAD was 100% with 3.6 false positives per scan for polyps ≥ 10 mm (n = 18), and 97% with 3.8 false positives per scan for polyps ≥ 6 mm (n = 33), respectively, whereas the conventional CAD scheme detected only 61% of the ≥ 10 mm and ≥ 6 mm polyps in the reduced-prep database.
"This was because the conventional CAD erroneously detected many of the solid feces with polypoid shapes as actual polyps in (the uncleansed data)," they wrote. "The proposed ftCAD scheme yielded higher performance than conventional CAD because it could differentiate tagged solid feces accurately from soft-tissue structures, while it facilitated the detection of polyps submerged in tagged fluid."
By Eric Barnes
AuntMinnie.com staff writer
June 25, 2007
Related Reading
Noncathartic bowel prep facilitates, complicates virtual colonoscopy, June 15, 2007
Prepless VC yields high sensitivity in average-risk subjects, June 10, 2007
New developments improve VC -- and colonoscopy, April 6, 2007
VC CAD ramps up detection of medium-sized polyps, March 12, 2007
CAD struggles through tagged, subtracted VC data, May 18, 2005
Copyright © 2007 AuntMinnie.com