Gastrointestinal Red Blood Cell Imaging
Red Blood Cell Labeling Techniques:
In-vivo
In vivo labeling has the worst labeling efficiency (75-85%, but the effective labeling efficiency is somewhat higher due to the renal excretion of some of the unlabeled pertechnetate). Stannous pyrophosphate (10-15ug/kg) is injected intravenously directly into a vein (injection via an indwelling catheter will generally result in poor labeling). The stannous ion (Sn+2) is the reducing agent and it diffuses into the red blood cells where it becomes bound to a cellular component. After 15-30 minutes, Tc99m-pertechnetate is injected IV and the tracer freely diffuses into the RBC's. The Tc-pertechnetate which enters the RBC's is then reduced from its +7 valence to +4. Reduced technetium then binds predominantly to the beta-chain of hemoglobin (76-79%), and a small amount binds to the heme portion of the molecule (19-21%). Any stannous ion present outside the RBC will reduce any free extracellular Tc-pertechnetate and this free reduced tech will degrade images by increasing background and urinary activity (confirm the presence of free tech by demonstrating stomach and thyroid activity).
In-vitro
The in vitro method has the best labeling efficiency. Previously, 50cc of whole blood was placed in a centrifuge and the RBC's were separated from the plasma. SnPYP was added to the cells which were then incubated with technetium pertechnetate.
The Ultra-tag kit method is now most commonly used and has a labeling efficiency of greater than 95%. About 3cc of the patients blood is placed in a vial with SnPYP. Sodium hypochlorite (an oxidizing agent) which cannot pass through the red cell membrane is then added to oxidize the extracellular stannous ion prior to the addition of Tc-pertechnetate. Although ACD (anticoagulant citrate dextrose solution) is preferred over heparin as the anticoagulant because it yields a higher labeling efficiency and reduced urinary activity (see below), excess ACD can decrease labeling efficiency by impairing the diffusion of the stannous ion across the RBC membrane.
Modified in vivo: "In vivtro" method
This method has a labeling efficiency of about 90-95%. Sn-PYP is given intravenously. After 10 to 30 minutes (for best results) 5 to 10cc of blood is withdrawn and technetium pertechnetate (20mCi) is added. After Incubating with the technetium for at least 20 minutes, the blood is replaced. ADC solution is the recommended anticoagulant.
Causes of Poor Red Blood Cell Labeling:
- Digoxin or calcium channel blocker: Decreases labeling rate by interfering with uptake of Sn2+ [12]
- Methyldopa: Disrupts oxidation of stanous ion; decrease in
reduction [15]
- Hydralazine: Disrupts oxidation of stanous ion; decrease in reduction [15]
- Dipyridamole or quinidine: Blocks transmembrane transport [12]
- Propranolol: Increases dissociation [12]
- Metronidazole or ranitidine: alters outer cell membrane
- Quinine: Possible antibody to RBCs
1. Heparinized patient- Heparin can form complexes with Tc-pertechnetate in the presence of stannous ion which will undergo renal excretion and accumulate in the bladder [15].
2. Chemotherapy
Disrupts RBC cell membrane [12]
Doxorubicin- lowered labeling efficiency in proportion to the
concentration of the drug [15]
3. Medications:
4. Generator ingrowth time > 24 hours:
Probably related to the presence of excessive Tc99 (Due to Tc99m decay). If generator in-growth is greater than 24 hours, then a 2nd elution should be obtained 1-2 hours after the first and used for erythrocyte labeling.
5. Injection through IV line- Due to adherence to wall
6. Improper syringe flushing- Always use saline rather than dextrose
7. Iodinated contrast - Given within preceding 24 hours - decrease in stannous reduction and alteration of Tc-99m binding [12,15]
8. Decreased hematocrit - Tc-99m is reduced
outside RBC's
9. Excess stannous ion- Tc-99m reduced outside RBC
10. Anti-RBC antibodies
11. Abnormal
hemoglobin- thalassemia, sickle-cell disease- impaired
labeling due to abnromal hemoglobin structure [15]
12. Recent blood tranfusion- unknown mechanism [15]
13. Tobacco- oxidation of stannous ion, possible damage
to RBC plasma membrane or possible chelating action on stannous
or pertechnetate ions (mechanism relates to reactive oxygen
species present) [15]
GI Bleeding Scintigraphy:
Lower GI bleeding is less common than upper GI bleeding- accounting for 25-33% of bleeding events [12]. Lower GI bleeding is more common in men, increases with age, and has a reported mortality of 4% [12]. For GI bleeds, the rate of blood loss will dictate the clinical presentation [11]. Patients may remain asymptomatic until blood loss exceeds 100 mL per day [11]. Tachycardia and hypotension occur when acute blood loss exceeds 500 mL [11]. Massive hemorrhage in the lower GI tract is defined as bleeding distal to the ligament of Treitz in excess of 30ml/hr. GI bleeding is most commonly seen in patients over age 50. Most episodes of GI bleeding stop spontaneously (75% of upper GI bleeds and 80% of lower GI bleeds), although intervention to control bleeding is needed eventually in 20-25% of patients [11].
Etiologies of GI bleeding:
Diverticular disease:
Diverticular disease is the most common cause of lower GI bleeding [12]. The dome of the diverticulum displaces the submucosal branch of the vasa recta, which can rupture. Although 80% of diverticular disease is located in the descending colon, approximately 50% of diverticular bleeding is from the ascending colon. Bleeding is the first indication of diverticulosis in 15-20% of patients, and bleeding can be severe in about 5%. Bleeding stops spontaneously in 80-90%, however, re-bleeding is seen in about 25% of the cases.
Angiodysplasia:
This lesion is felt to be acquired rather than congenital in nature because it is rarely seen in patients under the age of 40y. Repeat partial obstruction of submucosal veins due to transient elevations of intra-luminal pressure has been suggested as an etiologic factor. Concurrent cardiac disease (esp. aortic stenosis) is common. These lesions are most commonly detected in the ascending colon, but about 20% are located elsewhere (descending colon, sigmoid, small bowel). Multiple lesions are seen in about 25% of patients. The bleeding stops spontaneously in more than 90% of patients, but re-bleeding is seen to occur in up to 85%. Because vascular ectasias are submucosal they are not routinely identified on barium studies. Angiographically the hallmark of angiodysplasia is a vascular tuft, accompanied by an early and persistent prominent draining vein.
Polypectomy
Hemorrhage can be delayed for up to 2 hours following polypectomy. This delayed bleeding is thought to be associated with sloughing of the coagulated site.
Neoplasm
Neoplasms can produce lower GI bleeding in 2-26% of cases [12].
Ischemia
Nuclear Medicine GI Bleeding Examination
Scanning is useful for the diagnosis of active gastrointestinal bleeding and for guiding angiography. Either Tc99m Sulfur Colloid or Tagged RBC's can be used as the radiotracer. In general, scintigraphy is about 10 times more sensitive than angiography for the detection of GI bleeding.
Tc-99m Sulfur Colloid: (Dose 10mCi)
The advantages Tc-SC imaging is that the agent is rapidly cleared from the intravascular space by the reticuloendothelial system. The circulating half-life in patients with normal liver function is between 2-3 minutes, and by 15-20 minutes there is effectively none left in the blood. This permits clear visualization of extravasated isotope at bleeding site. The technique is very sensitive and can detect bleeding rates as low as 0.05 to 0.1 cc/min. (Angiography realistically requires a bleeding rate of about 1.5 to 3 ml/min. to be detected. Angiography will detect GI bleeding in 65% of patients when the bleeding rate exceeds 1 ml/min.)
Unfortunately, the disadvantages of this agent clearly outweigh its benefits. Prominent liver and spleen activity may obscure the bleeding site. The imaging time is markedly limited (probably no more than 10 minutes). Given the characteristic intermittent nature of GI bleeding, unless the patient is actively bleeding at time of study, the site of hemorrhage will not be detected. Reports have indicated that the sensitivity Tc-SC imaging for GI bleeding is about 30% of the labeled RBC technique. Because of this, to improve sensitivity, some centers will administer the agent in 2 mCi doses, every 10 minutes for an hour.
Technetium labeled RBC's: (Dose 20 mCi)
The main advantage of using labeled RBC's is that the agent
remains in the intravascular space for 24 (up to 48) hours, thus
it is excellent for imaging intermittent or slow bleeds. Liver,
spleen, kidneys and bladder (due to excretion of non-erythrocyte
bound tech and labeled hemoglobin fragments) are also visualized,
but to a lesser degree and thus will probably not obscure the
bleeding focus.The effective radiation dose estimate for an adult
undergoing RBC scintigraphy is approximately 6-7 mSv (compared to
15-25 mSv for CTA) [17].
Conventional angiography allows detection of bleeding only at rates of 0.5-1.0 mL/min and above [14,16] and CTA can detect bleeding rates of 0.3-1 mL [15]. The labeled RBC exam cannot detect bleeding rates as low at the Tc-SC exam, however, bleeding rates as low as 0.1 cc/min [13,16] to 0.5 cc/min. and sensitivities of over 90% have been reported for this procedure (the tagged RBC exam has a sensitivity of 93% and a specificity of 95% of GI bleeding [15]). The sensitivity is linked to the volume of extravasated RBC's at the bleeding site [12]. A focal volume of 3 mL can be readily detected, but hyperactive peristalsis can distribute the volume and reduce the sensitivity of the procedure [12]. Continuous imaging is recommended because it is often difficult to localize the bleeding site with intermittent imaging. In vivo labeling of the RBC's is also not recommended as free tech will be excreted by the gastric mucosa and pass into the small bowel and colon. Continuous gastric suction may be required if the in vivo labeling technique is used. In vitro tagging results in significantly less amounts of free technetium. Presently, many centers employ the use of the ultratag kit for labeling the RBC's prior to GI bleed imaging.
Glucagon may be useful in aiding the detection of small bowel bleeding by producing smooth muscle relaxation. Small bowel bleeds frequently show only brief accumulation with rapid dissipation due to marked small bowel motility. Smooth muscle relaxation in blood vessels will enhance bleeding and decreased intestinal peristalsis will cause tracer to pool at the bleeding site.
Most centers will image patients continuously for 60 to 90
minutes and generally, this time is sufficient to detect about 85%
of sites of GI bleeding. Longer imaging times can be used if
patients can tolerate it. The tagged RBC study is considered
positive if there is a focus of increased activity that conforms
to bowel and changes in location and increases in intensity over
time [15]. Blood in the bowel lumen will always move both
antegrade and retrograde due to intestinal irritation by the
intraluminal blood. The retrograde peristalsis can hinder accurate
localization of the bleeding site. Incorrect
localizations can be seen in 3 to 60% of cases. It is probably
prudent not to base surgery solely on the results of RBC
scanning. The portion of the foregut that is visualized on
bleeding scans include the stomach through second portion of the
duodenum which are perfused by the celiac trunk and branches; the
mid gut from the second portion of the duodenum through most of
the transverse colon (perfused by the SMA, pancreaticoduodenal
artery, intestinal arteries, ileocolic artery, right and middle
colic arteries); and the hindgut which includes the remaining
transverse colon to the superior portion of the anal canal
(perfused by the IMA- left colic artery, sigmoid branches, and
superior rectal artery) [15].
The tagged cell study may also provide prognostic information.
Confirmation of active bleeding with positive findings on the RBC
scan has been shown to increase the diagnostic yield of
angiography by a factor of 2.4 [16]. The time delay until the scan
becomes positive also carries clinical and prognostic significance
[16]. A patient with a positive exam within 12 minutes of scanning
correlates with having a positive angiogram [15]. Other authors
suggest a time to positive scan threshold of 9 minutes or less to
determine if the patient should proceed to angiography (the odds
of detecting bleeding on conventional angiography was 6.1 fold
higher when bleeding was detected on the RBC scan in 9 minutes or
less and the angiogram was negative in 94% of patients with a time
to positive scan of more than 9 minutes) [16]. In one study, no
patient with a negative exam or an exam which became positive
after one hour of imaging required surgery or excessive
transfusion (over 700 cc); while patients that demonstrated high
visual blood loss (activity within the bowel lumen greater than
the liver activity) within one hour of imaging typically required
surgery or larger transfusion requirements [Fink-Bennett, Harvard
94]. For patients with a time to positive exam of more than 9
minutes the number of units of blood transfused during a 24 hour
period may be used to identify patients who may still benefot from
angiography because each 1-unit increase in blood is associated
with a 27% increase in the odds of a positive angiogram [16]. A
transfusion requirement of 5 or more units within 24 hours is also
strongly associated with positive angiographic findings [16].
The time delayed between the RBC scan and the angiogram also
impacts on the likelihood for detecting the bleeding site [16].
Specifically, for every 1 minute increase in lag time between the
two exams, the odds of a positive angiogram decrease by 0.4%; and
for every hour in delay the odds of a positive angiogram decrease
by 24% [16].
When interpreting GI bleeding scans in anemic patients receiving blood transfusions, awareness of the possibility of gallbladder visualization on delayed images is important to avoid false-positive results [9]. Autohemolysis with resultant accumulation of the breakdown products of labeled heme in the bile seems to be the reason the gallbladder can be visualized in these patients [9].
|
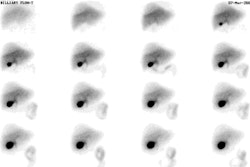
Active GI Bleeding: The images below show a brisk gastrointestinal hemorrhage which originates in the region of the hepatic flexure (black arrows on initial one and two minute images). The abnormality becomes more intense and propagates in an antegrade fashion over time. Assessment for active hemorrhage is best performed by reviewing the images in a cine loop (different case with cine of hepatic flexure bleed- approx. 2MB). |
|
|

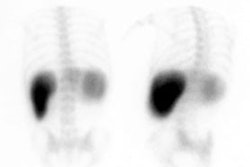
Delayed scanning (i.e.: at 24 hours) can demonstrate the presence of blood within the bowel lumen, but alone it cannot provide information as to the location of the bleeding site. When delayed GI bleeding images are positive, further views should be obtained to ascertain if the pattern of intraluminal activity is changing (i.e.: is there active hemorrhage). If renewed active hemorrhage is suspected, reinjection with a second dose of labeled RBC's may identify the bleeding site [6]. The activity from the reinjected dose should render the previously identified extravasated RBCs barely visible.
- Vascular Neoplasm: Foci will not move over time
- Splenosis: Foci will not move over time
- Varices: (Alcoholics) Blood may pool in dilated venous channels over the abdomen
- Vascular Grafts: Will appear as tubular structures
- Bladder/Penile activity: Confirm with lateral view
- Inflammation: Usually demonstrates an early blush and does not change in location over time.
Interventional Therapeutic Techniques for GI bleeding:
Intraarterial vasopressin therapy for lower GI hemorrhage involves placing a catheter into the main trunk of the SMA or IMA depending on the bleeding site. It is most effective in patients who have diverticular bleeding. The goal of vasopressin therapy is a reduction in the splanchnic arterial pressure at the arterial or capillary level which facilitates the formation of a clot at the bleeding site. The infusion is started at 0.2 U/min. If active hemorrhage is still detected on a follow-up angio performed in 30 minutes, the infusion is increased up to a maximum of 0.4 U/min. The infusion is continued for up to 12 hours, at which time the dose is reduced by half. After an additional 6 to 12 hours, the infusion is discontinued and saline infusion continued. Abdominal cramping is a common side effect due to bowel contraction induced by the vasopressin. Vasopressin is not given I.V. because of possible tachyphylaxis, potential coronary vasoconstriction, and a relatively short duration of therapeutic benefit. Superselective transcatheter embolization of small mesenteric arterial branches is an alternative for treating active small bowel/proximal hemorrhage. [3]
Vascular Hepatic Lesions:
Cavernous Hemangioma
Clinical:
Cavernous hemangioma is the most common benign liver tumor with a 3 to 7% incidence from autopsy data. F > M (4:1). They are typically asymptomatic (only about 10% of patients have symptoms). Rupture with hemoperitoneum is a rare, but potentially serious complication. The lesions are most frequently subcapsular (peripheral) in the right lobe. Hemangiomas are typically solitary, but may be multiple (10-20% of cases). Treatment is not usually necessary, but steroids, XRT, and embolization have all been shown to decrease size of the lesion.
On pathologic analysis the internal architecture of the lesion changes with growth, and there may be hemorrhage, myxomatous change, fibrosis, or calcification. Hemangiomas lack a capsule, but are well marginated.
Radiologic Appearance:
On plain film one may see calcification (noted in only 10%)- may see phleboliths or radiating "sunburst" pattern. On ultrasound the lesion is typically homogeneously hyperechoic, well defined, lobulated mass (60%). Increased through transmission may be seen. Other appearances include a hypoechoic mass (20%, particularly in fatty, echogenic livers) or a mixed echo pattern (20%). No flow is detected in the lesions on pulsed/color flow Doppler due to the low velocity through the large cavernous spaces. No hemangiomas showed a Doppler shift greater than 0.7 kHz, while hepatocellular carcinomas had shifts of 5 kHz or greater. [1]
On pre-contrast CT scan hemangiomas typically appear as low density lesions (90%). In the case of fatty infiltration of the liver, the hemangioma may appear hyperdense. Post-contrast there is early peripheral enhancement, which may be nodular, that slowly fills in the lesion and remains for a relatively long period of time. These classic findings are noted in 50 to 75% of cases. Inhomogeneous enhancement can be seen if there are focal zones of thrombosis or fibrosis.
MRI has an accuracy of between 90-95% in the detection of hemangiomas. The lesions have very low signal on T1. On T2 weighted images, the lesions have a very bright signal and they remain of high intensity on multiple delayed echo sequences. Unfortunately, all hepatic neoplasms become hyperintense relative to surrounding liver, so it is the degree of hyperintensity that is stated to be characteristic of hemangiomas. This appearance can be mimicked by vascular mets and occasionally by simple cysts. There is about a 10% overlap between hemangiomas and non-hemangiomas. Occasionally, the lesions may have an inhomogeneous appearance.
On angiography, hemangiomas appear as focal areas of ring, or C-shaped contrast accumulation which persists into the late venous phase. "Puddling" of contrast within the lesion, with markedly delayed clearance- produces cotton-wool appearance. A-V shunting is RARE and implies a MALIGNANT lesion.
Scintigraphic findings for vascular hepatic lesions:
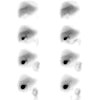
Cavernous hemangioma:
Hemangiomas appear as photon deficient (cold) lesions on sulfur colloid and hepatobiliary scans.
Tc-RBC imaging is the most specific test available for the diagnosis of cavernous hemangioma. (Sensitivity 90% for lesions larger than 1.5 to 2cm; Specificity approaches 100%; Accuracy 90-95%) With SPECT lesions down to about 1 cm in size can be detected [SPECT sensitivity by size: 1.5 cm (100%), 1 cm (65%), 0.5 cm (20%)]. False negatives may occur due to small size of the lesion, lesion adjacent to a vascular structure (vein, liver hilum, or heart), or thrombosed/fibrosed lesion [5]. Lesions located deep within the liver may not be detected by planar imaging, but are often readily demonstrated with SPECT.
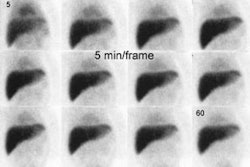
The classic findings on RBC imaging are decreased activity within the lesions on flow and early blood pool images, with increased activity on delayed scans at 1 to 2 hours post injection (hot spot on delayed imaging) [5]. Lesions that show increased perfusion (i.e.: concurrent with the spleen) suggest a predominant arterial blood supply and if they show decreased uptake on delayed images are almost always metastases or hepatomas. However, 80% or more of malignant lesions, primarily metastases, are hypovascular throughout the first phase of the exam and remain photopenic on delayed images. Hepatomas occasionally have uptake equal to, but not more intense than the liver on delayed images.
There are only case reports of false positive exams: Hepatic angiosarcoma, carcinoid metastasis [4], metastatic carcinoma of the colon, and hepatoma. Although it is rare for a hepatoma to demonstrate increased delayed blood pool activity, underlying severe liver disease can be problematic in these patients as there is no normal hepatic blood pool activity for comparison [4]. Also, in 2 of the 4 cases of hepatoma with increased activity on delayed images compared to the adjacent liver, there was increased arterial flow to the lesion on perfusion images [4]. In one review, early flow and delayed filling was seen in 3% of hemangiomas, nonetheless, in these instances a malignant lesion must be excluded. [2]
Hemangioendothelioma:
Hemangioendotheliomas typically present in children less than 6 months of age. The classic presentation is one of hepatomegaly associated with CHF, however, the lesion may present as asymptomatic hepatomegaly and simulate a primary hepatic malignancy. The lesion is usually multifocal and will spontaneously regress, but they are also generally responsive to steroid therapy.
On Tc-SC imaging, hemangioendotheliomas typically demonstrate increased flow, but appear as defects on later images [7]. On Tc-RBC scintigraphy, these lesions demonstrate increased flow, increased blood pool, and increased activity on delayed images which is equal to or greater than that of the heart [7]. Hepatoblastomas, nodular hyperplasia, and fibrovascular mesenchymal hamartomas have all been shown to potentially demonstrate increased activity on all 3 phases of the exam, but none of these lesions has been shown to have activity equal to or greater than the heart on delayed images. Neuroblastoma typically produces a cold defect on later images and generally has no associated flow or blood pool abnormality.
Hepatoblastoma:
Hepatoblastoma is the most common primary malignant tumor in young children (up to age 5y). About 50% of cases present before 1 year of age. Patients typically present with an asymptomatic RUQ mass, but anemia, weight loss, or jaundice can also be seen. Alpha-fetoprotein levels are elevated in 60 to 80% of cases. On Tc-SC imaging, the lesion is noted to have hypervascular flow, but will appear as a cold defect on delayed images. Very necrotic lesions may appear cold on both flow and static images. Very rarely, increased Tc-SC uptake has been reported.
REFERENCES:
(1) Radiology 1987; Taylor: p.643
(2) Nuclear Medicine Annual 94, p.66
(3) AJR 1993; Zuckerman DA, et al. Massive hemorrhage in the lower gastrointestinal tract in adults: Diagnostic imaging and intervention.161: 703-711
(4) J Nucl Med 1993; Farlow DC, et al. A case of metastatic malignancy masquerading as a hepatic hemangioma on labeled red blood cell scintigraphy. 34: 1172-1174
(5) Critical Reviews in Diagnostic Imaging 1990; Lipman JC, Tumeh SS. The radiology of cavernous hemangioma of the liver. 30: 1-17
(6) J Nucl Med 1991; Jacobson AF. Delayed positive gastrointestinal bleeding studies with technetium-99m-red blood cells: Utility of a second injection. 32: 330-332
(7) J Nucl Med 1987; Miller JH. Technetium-99m-labeled red blood cells in the evaluation of hemangiomas of the liver in infants and children. 28: 1412-1418
(8) Semin Nucl Med 1984; Srivastava SC, Chervu LR. Radionuclide-labeled red blood cells: Current status and future prospects. 14: 68-82
(9) Clin Nucl Med 1988; Kotlyarov EV, et al. Gallbladder visualization during technetium-99m-RBC blood pool imaging. Case report and literature review. 13: 515-16
(10) Radiation Medicine 1988; Sato S, et al. Delayed visualization of gallbladder with in vivo labeled Tc-99m-red blood cell scintigraphy for gastrointestinal bleeding. 6: 159-161
(11) Radiographics 2007; Laing CJ, et al. Acute gastrointestinal bleeding: emerging role of multidetector CT angiography and review of current imaging techniques. 27: 1055-1070
(12) J Nucl Med 2008; Mariani G, et al. Radionuclide evaluation of the lower gastrointestinal tract. 49: 776-787
(13) AJR 2008; Zink SI, et al. Noninvasive evaluation of active
lower gastrointestinal bleeding: comparison between
contrast-enhanced MDCT and 99mTc-labeled RBC
scintigraphy. 191: 1107-1114
(14) Radiographics 2013; Uliel L, et al. Nuclear medicine in the
acute clinical setting: indications, imaging findings, and
potential pitfalls. 33: 375-396
(15) J Nucl Med 2016; Grady E. Gastrointestinal bleeding
scintigraphy in the early 21st century. 57: 252-259
(16) AJR 2016; Chung M, et al. Acute lower gastrointestinal
bleeding: temporal factors associated with positive findings on
catheter angiography after 99mTc-labeled RBC scanning.
207: 170-176
(17) AJR 2016; Feuerstein JD, et al. Localizing acute lower
gastrointestinal hemorrhage: CT angiography versus tagged RBC
scintigraphy. 207: 578-584