During the 1990s when technologies such as PACS, speech recognition, RIS, and computer-aided detection (CAD) were being rolled out at a frenetic pace, attendees at the RSNA annual meeting could always anticipate being wowed by innovation in infoRad, a special area at McCormick Place devoted to radiology informatics.
The infoRad concept has since been retired, but at this year's meeting the RSNA brought back some of its spirit with its Quantitative Imaging Reading Room of the Future, a dedicated zone where a steady stream of visitors heard expert presentations about and interacted with 23 exhibits of future IT technology that may well transform the specialty.
The RSNA defines "quantitative imaging" as the extraction of quantifiable features from medical images for assessing normal conditions, or the severity, degree of change, or status of a disease, injury, or chronic condition relative to normal. It includes the development, standardization, and optimization of anatomical, functional, and molecular imaging acquisition protocols, data analyses, display methods, and reporting structures.
Invitations to participate in the exhibition were sent to more than 1,000 academic applications developers and technical exhibitors, according to Fiona Miller, RSNA's director of research. Participants were selected based on applications that currently or soon will be publicly available and that could be integrated into the typical workflow of a working radiologist. Interactive exhibits were grouped into modules representing image acquisition, image analysis, automated measurement, image display, and structured reporting.
AuntMinnie.com reports here on three demonstrations.
Image-based biomarkers for breast cancer
A team of medical physicists and radiologists from the University of Chicago demonstrated its real-time quantitative analysis workstation used to evaluate multimodality breast images. The demonstration, headed by Maryellen Giger, PhD, faculty director of the university's Imaging Research Institute, showed how different analyses can yield image-based biomarkers.
The biomarkers could potentially contribute to a more accurate diagnosis and/or help assess a patient treatment plan. In particular, the imaging biomarkers can be used to predict malignancy, malignancy subtypes, prognosis, and response to therapy.
The multimodality workstation simultaneously displays mammography, ultrasound, and breast MRI images and now incorporates CAD functionality. Giger and colleagues demonstrated how lesion characteristics such as morphological and texture features are displayed on the active view of the lesion of interest, including a calculation of an estimated probability of malignancy from mammography and ultrasound images.
With respect to multiparametric MRI CAD, the workstation displays a computer-segmented lesion and a histogram for lesion characteristic and cancer prevalence, and it has controls for lesion segmentation. Image selections may be viewed as precontrast, dynamic contrast-enhanced postcontrast subtraction, or T2-weighted images. Kinetic uptake curves can be calculated for the entire lesion and most enhancing regions within the lesion. Another display includes a diagnostic color map of contrast uptake within the lesion; this display is one of several novel MRI lesion color maps based on both kinetics and morphology.
One interactive session showed how three image-based prognostic biomarkers based on quantitative analysis of MRI images could differentiate between ductal carcinoma in situ and invasive ductal carcinoma, between lymph-node positive and node-negative cancers, and between grade III tumors and those of a lesser grade. As an example of assessing a response to chemotherapy, the demonstrators showed how the workstation could differentiate between lesions that will decrease in size during the course of therapy and those that will not.
The workstation was used in a preliminary association study between image-based biomarkers and genomic biomarkers for breast cancer risk assessment, which determined that the genetic contribution of UDP-glucuronsyltransferases-2B genes seemed to be associated with mammographic parenchymal patterns and breast density. In this RSNA scientific paper presentation, Hui Li, an assistant professor in the University of Chicago's department of radiology and one of the interactive demonstration presenters, explained how the relationship between image-based and genomic biomarkers may yield a future role in personalized medicine.
Automated analysis of stenotic lesions
The Quantitative Imaging Reading Room of the Future included a number of educational exhibits of recently commercialized products. One of these included a CAD system that automatically analyzes coronary arteries and indicates the presence and location of significant coronary artery stenosis detected in coronary CT angiography images acquired from 64-slice or higher CT scanners.
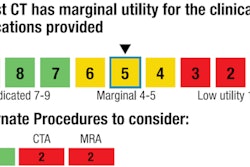
The system (COR Analyzer System, Rcadia Medical Imaging, Auburndale, MA) displays an immediate indication of healthy patients and those with suspected coronary artery stenosis by indicating a green or red "heart" symbol on a patient database. It produces detection marks indicating the location of candidate lesions.
The software is designed to function as an autonomous decision-support system when an experienced reader for coronary CT angiography studies is unavailable, as a prioritization tool for high-volume practices, as an early response alarm system for CT technicians, and as a second opinion diagnostic aid, said Roman Goldenberg, PhD, the company's chief technology officer.
Open-source tools for radiology reporting
Radiologists and medical physicists at Stanford University in Stanford, CA, have a vision: to achieve seamless integration of quantitative information about a disease, regardless of the platform used to view or quantify imaging information. In this interactive exhibit, a team led by Daniel Rubin, MD, assistant professor of radiology, showed that by standardizing the collection and storage of image metadata using the Annotation and Image Markup (AIM) standard, image-based analysis of diseases and response to treatment can be performed regardless of the platform for viewing or extracting quantitative image metadata from images.
The exhibit showed how the task of tracking cancer lesions could be automated by collecting and exchanging image annotations in the AIM format. AIM is an open standard that specifies standards-based syntax for recording information about lesions, including radiologists' observations, measurements, and other quantitative information.
The AIM standard format is used in iPAD, an open-source, semantically aware image annotation tool that is a plug-in to the OsiriX image viewing workstation. iPAD extracts and saves quantitative and semantic image metadata in AIM standard format, and permits measurement and semantic classification of lesions and automated quantitative assessment of the Response Evaluation Criteria in Solid Tumors (RECIST) criteria.
In the demonstration, a hypothetical pancreatic cancer patient who received his diagnosis at Hospital A is referred for treatment at Hospital B. Although each hospital uses different diagnostic workstations, the annotations on lesions are all stored in common AIM format in a database or in a PACS. A commercial system that automates lesion segmentation and/or quantification then processes these annotations and stores its output as new AIM annotations. A vendor-neutral lesion tracking/analysis system processes the AIM data to summarize patient response to treatment over time, and also compares image biomarkers.
The iPAD annotation tool assists reviewers in tracking cancer lesions and automatically applies RECIST response criteria directly from image annotations. This eliminates the need to perform calculations and apply criteria by hand. After readers annotate lesions, RECIST evaluations of response can be automatically reported.
AIM is a crucial image metadata standard, the team demonstrators emphasized. They encouraged that radiologists should insist that this standard be supported in all vendor's commercial products that they purchase.
By Cynthia E. Keen
AuntMinnie.com staff writer
December 10, 2010
Related Reading
CAD boosts new readers in diagnosing stenosis on CTA, November 28, 2010
AIM standard added to commercial PACS workstation, November 8, 2010
OsiriX plug-in adds structure to image annotation, November 2, 2009
MRI diagnostic workstation differentiates breast tumor subtypes, July 31, 2008
Copyright © 2010 AuntMinnie.com