
In the short term, this is not necessarily inappropriate: richer consumers and countries tend to spend more discretionary income on health and healthcare. In the long term, however, we know that there are other priorities for our spending, such as education, research, public health measures, and so on. Thus, the National Health Expenditure (NHE) report, which is issued each year by the Centers for Medicare and Medicaid Services (CMS), should be read carefully. As government agencies and individuals prioritize their spending, our practices will likely be affected.
The National Health Expenditure report
In 2003, the total spending on healthcare in this country reached $1.68 trillion, a figure that exceeds any other single type of spending in this country and also exceeds the total healthcare spending in every other country. On a per-capita basis, we are currently spending $5,670 per person. Both the aggregate figure and the per-capita figure are growing at rates above consumer inflation: 7.7% and 6.6%, respectively, compared with inflation of roughly 1.8% in 2003.
There were two areas in the NHE report that I think are worth looking at -- one of which I have consistently dismissed, but can no longer "write off" as a statistical anomaly. The NHE report has consistently included "program administration and net cost of insurance" as a separate category.
Over the years, I have observed rather dramatic shifts in this figure and have assumed it was due to the difficulty in correctly assessing this figure each year. However, the trend is now obvious and the aggregate amount somewhat astonishing -- $119.7 billion.
For the past two years, the rate of growth has exceeded all other categories (16.3% and 13.2%, respectively), including the rate of growth of prescription drug spending. The costs of administration of Medicare and Medicaid, at the government level, have been rather flat; thus, we are in the middle of a trend where nongovernmental healthcare administration costs are consuming a larger piece of the pie. I will leave it to the reader to contemplate what this means, but it does raise concerns as to how our healthcare dollars are being spent.
The second area worth reviewing is the shift to private sector spending growth. 2003 was a good year for the economy, which does tend to favor private sector growth, but the current situation bears watching. As the accompanying graph shows (figure 1), the growth in private spending is now outstripping the growth in public spending. This in and of itself is not surprising. However, as you will note, the level of public spending growth during the last economic slowdown (2001-2002) was practically the same as private spending growth, quite different from previous recessions (see the effects during 1991-1994).
I firmly believe that we are in the middle of a vigorous effort to shift more spending into private hands, an effect that will make our practices more reliant on our managed care intermediaries and less reliant on Medicare reimbursement. For those who have great faith in their ability to negotiate with managed care entities, this is a good trend. For those who derive comfort in the stable share of the market that Medicare represents, this may be of concern.
| Figure 1. Public versus private health spending |
 |
| Figure 1: Rate of growth in private and public sector spending in the U.S. for 1986-2003. The lowermost line represents the net difference between the two. As one can note, the most recent year showed net relative growth for the private sector. Source: National Health Expenditure report; Centers for Medicare and Medicaid Services; various years. |
Employment Cost Index report
The Employment Cost Index report was issued by the U.S. Bureau of Labor Statistics at nearly the same time as the NHE report was released. This report adds an important perspective to the national health expenditures issue. In this particular report, the overall figures demonstrate no major wage inflation, which translates into lower fears of overall consumer price inflation since labor is such an important component to costs in our heavily service-oriented economy.
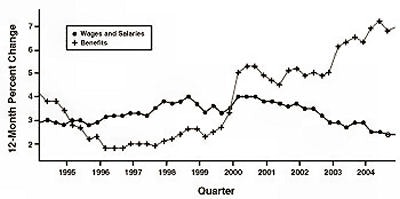
Anyone who looks at the accompanying chart (figure 2), however, will see a disturbing trend. Benefit costs (almost entirely driven by healthcare benefits) are continuing to rise at rates that are well above the rate of consumer price inflation, while wages and salaries are now increasing at rates that are below consumer price inflation (2.9% in 2004). This means that the average worker in this country (in what is arguably a good job market) is now taking home less "real" income than in the previous year. This represents the real-life effects of the escalating costs of healthcare in this country.
| Figure 2. Employment Cost Index for civilian workers |
 |
| Source: U.S. Bureau of Labor Statistics. Final data for 2004. Note the upper line (on the right side of the chart) representing growth in employer benefit costs and the decline in the rate of growth for wages and salaries. |
As more people feel the pinch of healthcare costs (as evidenced in the Employment Cost Index report) the more scrutiny those costs will receive. I expect that CMS will soon (within the next three years) break out imaging costs in the NHE report. We are already approaching figures that will draw the public's attention (however much this figure might include our cardiology and/or self-referring colleagues). Once this number gets published, we will only face more scrutiny.
MedPAC, as noted in the March issue of the American Journal of Roentgenology, has already identified areas of concern for imaging spending, and Congress is likely to act on MedPAC's recommendations. It is critical for us to refocus our efforts on evidence-based imaging and to improve the visibility of the many good things that radiologists can offer. A focus on long-term sustainability, rather than short-term profitability, is essential if we want our field to continue to be successful.
By Dr. Howard P. Forman
AuntMinnie.com contributing writer
May 4, 2005
Dr. Forman is an associate editor of health policy for the American Roentgen Ray Society (ARRS). This article originally appeared in the American Journal of Roentgenology (April 2005, Vol. 184:4). Reprinted by permission of the ARRS.
Related Reading
ACR criteria cut imaging costs in Israel, January 11, 2005
ACR to pitch Congress on 'designated physician imagers' for Medicare, January 6, 2005
Nation's largest insurer to adopt ACR criteria, accreditation, December 12, 2004
States, payors seek to stem tide of self-referral abuse, October 29, 2004
Stark II interim final rule leaves huge self-referral loophole, July 20, 2004
Copyright © 2005 American Roentgen Ray Society