CHICAGO - After years of steady decline, use rates for noninvasive diagnostic imaging have begun to rise again, according to research presented this week at the RSNA 2017 conference.
Why? The reason isn't clear yet, said presenter Dr. David C. Levin of Thomas Jefferson University in Philadelphia. Levin and colleagues Laurence Parker, PhD, and Dr. Vijay Rao conducted the research under the auspices of the university's Center for Research on Utilization of Imaging Services (CRUISE). But if the trend continues, radiologists will certainly benefit.
"Use rates of noninvasive diagnostic imaging in the Medicare population have steadily declined since 2008," Levin told session attendees. "This has been good for the healthcare system as a whole, but not so good for radiologists. We conducted our research to determine whether this downward trend has continued."
Steady decline
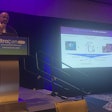
 Dr. David C. Levin from Thomas Jefferson University.
Use rates for noninvasive diagnostic imaging began to drop in 2008, a year after the Deficit Reduction Act of 2005 went into effect. But in 2015, these rates began to rise, Levin's team found.
"We've had all these years of downturn since 2009, but all of sudden, in 2015, there was an uptick in use rates," he told AuntMinnie.com. "We thought that was worth investigating."
Levin and colleagues used Medicare Part B fee-for-service databases for 2003 to 2015 (including 37.5 million beneficiaries in 2015). They extracted all current procedural terminology (CPT) codes for noninvasive diagnostic imaging in the 70,000 (radiology) and 90,000 (medicine: evaluation and management) series, and analyzed global and professional component claims. The researchers then calculated use rates per 1,000 Medicare beneficiaries.
Overall Medicare utilization rose substantially between 2003 and 2008, peaking at 4,422 per 1,000 beneficiaries. Between 2008 and 2011, noninvasive diagnostic imaging use rates declined, primarily due to code bundling in echocardiography in 2009, myocardial perfusion imaging in 2010, and CT of the abdomen and pelvis in 2011. Even after this code bundling, use rates continued to drop in 2012, 2013, and 2014, Levin said. In 2014, the use rate was 3,434 exams per 1,000 beneficiaries.
But in 2015, the overall noninvasive diagnostic imaging use rate increased by 2.1%, to 3,507 per 1,000 beneficiaries; between 2014 and 2015, individual noninvasive diagnostic imaging modalities also increased: CT by 4.7%, MRI by 3.3%, echocardiography by 1.3%, noncardiac ultrasound by 1.6%, radiographic imaging by 2%, and PET by 2.2%. During this time frame, only non-PET nuclear medicine declined, by 2.3%. Total Medicare fee-for-service noninvasive diagnostic imaging volume in 2014 was 128.4 million, increasing to 131.5 million in 2015.
| Diagnostic imaging use rates per 1,000 Medicare beneficiaries, 2014-2015 | |||
| 2014 | 2015 | Percent change | |
| CT | 514 | 538 | +4.7% |
| MRI | 183 | 189 | +3.3% |
| Echocardiography | 237 | 240 | +1.3% |
| Noncardiac ultrasound | 435 | 442 | +1.6% |
| Radiographic imaging | 1,895 | 1,933 | +2% |
| PET | 18.2 | 18.6 | +2.2% |
| Non-PET nuclear medicine | 87 | 85 | -2.3% |
Levin and colleagues also found that rates of noninvasive diagnostic imaging use increased between 2014 and 2015 regardless of place of service. In 2014, the office rate was 1,029 per 1,000 beneficiaries, the hospital outpatient department rate was 948 per 1,000, and the emergency department rate was 541 per 1,000; in 2015, these rates increased to 1,044, 990, and 573, respectively.
Anomaly or new trend?
So is this an anomaly, or is it the start of a new trend? It's probably too early to tell, Levin said. Medicare Part B fee-for-service 2016 data should be released in late December or in January, and the information should offer a clearer picture.
"This data we reviewed is encouraging, in that it suggests that the downward trend in diagnostic imaging use rates has stopped," Levin told AuntMinnie.com. "We'll know more after the new year if we're seeing the beginning of a trend toward increased imaging use."


