SAN DIEGO - Imaging growth in the U.S. hasn't risen nearly as dramatically as the government says it has; in fact, it's been pretty flat, according to researchers who presented a study on the topic on Monday at the American Roentgen Ray Society (ARRS) meeting.
Beginning in 2005 -- well before implementation of the Deficit Reduction Act (DRA) of 2005 -- imaging utilization ended its meteoric rise, plateaued, and then stayed level, according to Dr. David Levin and colleagues from Thomas Jefferson University's Center for Research on Utilization of Imaging Services in Philadelphia.
In a nutshell, the government's numbers make radiology look like it performs more discretionary imaging exams than it does, and they make the DRA seem more effective than it has been in cutting spending, Levin said.
A September 2008 report from the U.S. Government Accountability Office (GAO) concluded that while the Deficit Reduction Act had substantially reduced imaging expenditures, utilization rates increased. During the first year after the DRA was implemented, Medicare Part B payments dropped about 15% for advanced noninvasive diagnostic imaging (NDI) and about 5.4% for other imaging modalities, Levin said.
The report also noted that overall imaging utilization increased by 3.2% in 2007, and the growth rate for advanced imaging (CT, MRI, and nuclear medicine) went up by 3.9% that year.
"The implications of this were that the DRA did not reduce beneficiaries' access to imaging" by cutting payments, Levin said.
Poor methodology, unexplained
For starters, the GAO never explained its methodology in calculating the utilization rates, so it was left to Levin and colleagues Dr. Vijay Rao, Laurence Parker, Ph.D., and Andrea Frangos to pore through the same Medicare data to determine how the GAO came up with its numbers, a task that took many hours of analysis.
Levin said he also spent many hours trying to confirm the information with the GAO, even meeting with its director at one point, to no avail (AuntMinnie.com did not contact the GAO for this story). But complying with Levin's request wouldn't be an easy task for the GAO, Levin said in its defense. Teams of individuals typically work on projects, and turnover is a factor.
Levin and colleagues concluded that the government's methodology had several shortcomings, including the following:
- The GAO examined only codes subject to the Hospital Outpatient Prospective Payment System (HOPPS) cap.
- The agency looked only at studies performed in physician offices. Outpatient imaging encompasses not just what's conducted in offices, but also what's done in hospital outpatient facilities, Levin said.
- "We think they included nondiscretionary studies, that is, studies that are mandated by the patient's clinical condition" such as interventional procedures, imaging guidance, radiation therapy planning, etc., that should not have been included, Levin said.
- The GAO likely included radioimmunoassays (which are lab tests, not imaging studies).
- The agency included technical component claims, in addition to global and professional component claims, and by doing so double-counted all of the technical component claims.
"The way you do this right, which is what we did, is to look at only discretionary use of imaging," Levin said. "In our study, we didn't include CT or MRI guidance, radiation therapy planning, interventional procedures, or add-ons for image postprocessing. We included studies that are done in hospital outpatient facilities as well as those done in private offices."
In Levin's study, immunoassays were excluded; global and professional component claims but not technical component claims were included. The document used for the analysis was the Medicare Part B Physician/Supplier Procedure Summary Master File, 2000 through 2008. Finally, the researchers calculated rates per 1,000 for all CT, MR, and nuclear scan codes.
The researchers have just completed their analysis of the 2008 data, which continue the same trends, Levin said.
The results show a steep drop in utilization growth for advanced noninvasive diagnostic imaging: After steady growth that averaged 5% annually from 2000 to 2005, the overall outpatient utilization rate increased only 0.7% from 2005 to 2006 and an additional 0.7% from 2006 to 2007. In contrast, the GAO had reported a 3.2% increase between 2006 and 2007.
 |
| CAGR = compound annual growth rate. All images courtesy of Dr. David Levin. |
 |
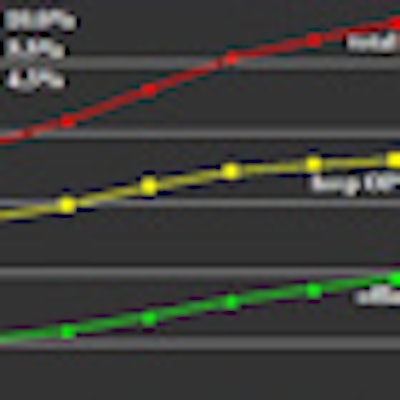
For the three advanced NDI modalities as a group, outpatient utilization grew by an average of 12% per year from 2000 to 2005, with growth dropping to 3.8% from 2005 to 2006 and to 1.7% from 2006 to 2007.
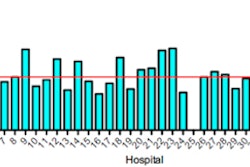
By 2007, the total outpatient rate for the advanced NDI group as a whole was 666.2 (imaging utilization per 1,000). The individual outpatient rates in 2007 and the percentage changes from 2005 to 2006 and then 2006 to 2007 were as follows:
- MRI -- 137.6 per 1,000, +3.7%, +1.0%
- CT -- 277.9 per 1,000, +5.5%, +4.3%
- Nuclear medicine -- 250.7 per 1,000, +2.1%, -0.8%.
 |
 |
 |
Each of the above categories in the 2008 numbers, though not presented in detail in Monday's session, "continue the same flattening" of the curve, Levin said, meaning that growth continued its slowing trend through 2008, the last year for which data are available.
In 2007, the overall outpatient utilization rate of NDI did not go up by 3.2% as the GAO report stated; it increased by only 0.7%, Levin said in summary. That year, the combined utilization rate of advanced imaging did not increase by 3.9% as the GAO report stated but, instead, grew by 1.7%.
"[Imaging] is not growing as rapidly as some of the authorities think it is growing," he said. "There has been an effect of slowing in the growth of diagnostic imaging. Hopefully, if the major payors and policymakers see this, they'll focus a little bit less on the costs of imaging and take that spotlight off of us in radiology."
The results show that the slowdown in outpatient imaging predated the advent of the DRA in 2007 and is undoubtedly due to other factors as well, he said, possibly including concerns about radiation.
In addition, radiology benefits management (RBM) firms "have had a major impact on the thinking of ordering physicians; they know that now they have to pay a little bit more attention to how they order diagnostic imaging," Levin said.
Finally, physicians are becoming more cost-conscious in general, Levin said. "They're realizing that the growth in medical costs just can't go on forever."
By Eric Barnes
AuntMinnie.com staff writer
May 4, 2010
Related Reading
U.S. children's hospitals reduce CT exam volume, April 29, 2010
GAO takes on self-referral study, April 29, 2010
Medicare cancer imaging grows at twice rate of overall expenses, April 27, 2010
Final answer on equipment use rate: 75% in 2011, March 26, 2010
Study offers more nuanced views of U.S. imaging use rates, March 22, 2010
Copyright © 2010 AuntMinnie.com