PET Myocardial Imaging:
Presently SPECT imaging is responsible for the great majority of cardiac imaging applications. Findings on the SPECT exam have both diagnostic and prognostic value. PET imaging has certain advantages including higher spatial and temporal resolution (although actual spatial resolution is degraded as the positron travels a varying distance prior to undergoing an annihilation reaction), superior attenuation and scatter correction, higher first pass tracer extraction, and the capability to perform quantitative measurements such as absolute myocardial blood flow and coronary flow reserve [17,37,46,62,132]. The axial spatial resolution of modern PET scanners ranges from 5 to 6.5 mm full width at half-maximum [95]. Like SPECT, PET myocardial imaging can also provide diagnostic and prognostic information.
In the detection of coronary artery disease with at least one coronary artery with >50% stenosis [85], PET imaging has an average weighted sensitivity of 90% (range 83-100%), an average specificity of 89% (range 73-100%, which is higher than SPECT--75%), an average PPV of 94% (range 80-100%), an average NPV of 73% (range 36-100%), an overall accuracy of 90% (range 84-98%), and a normalcy of 89 to 95%. The higher specificity is related to the capability of PET imaging to provide attenuation correction that decreases the false positive rate. Studies that have compared PET to SPECT imaging, have demonstrated PET imaging to be superior to SPECT with weighted mean sensitivity and specificity for PET of 91% and 90%, respectively (compared to 83% and 72% for SPECT) [85]. However, reconstruction artifacts producing false-positive defects can occur in a significant number of cases due to mis-registration between transmission and attenuation correction CT scans. Careful review of superimposed transmission and CT data sets should be performed to ensure correct registration. Acquiring separate rest and stress transmission scans can help to reduce mis-registration artifacts [32].
At the present time, stress testing with PET must be performed with a pharmacologic agent [29]. Because the exercise component of a stress test in patients who are able to exercise provides independent prognostic information, the use of PET imaging should be reserved for patients unable to exercise, those with a prior equivocal SPECT exam, or in whom body habitus would degrade SPECT imaging [29].
PET
Perfusion Imaging
Physiology
of perfusion imaging
PET
perfusion imaging
Perfusion
imaging
using some form of stress (exercise or pharmacologic) has been
employed to detect coronary artery stenosis.
Myocardial oxygen demand must be met by some absolute level of
MBF, allowing for individual variation in efficiency of
utilization [100]. Myocardial blood flow (MBF) at rest remains
normal during the progression of coronary lesions until there
is an 80-85% diameter stenosis,
while hyperemic MBF after maximal coronary vasodilatation
begins to decrease progressively if the stenosis
is more than about 40% [62,82]. Therefore, compared to
rest imaging, an exercise exam is more likely to detect regions
of ischemia. An advantage of PET
perfusion imaging compared to SPECT imaging is that global and
regional myocardial blood flow (MBF) can be quantified in
ml/gm/min [71]. In normal coronary arteries the resting
myocardial blood flow is approximately 1 mL/gm/min
(0.6-1.3 mL/gm/min) [64,82,100,134].
Baseline myocardial blood flow (MBF) is slightly higher in
women [64] and is commonly also higher in patients with higher
arterial blood pressure or heart rates (due to higher
myocardial workload requirement) [134]. Resting MBF falls only
in the presence of critical subocclusive stenosis and poorly
developed collateral blood flow [134]. MBF can increase 2- to
3-fold with exercise (maximum coronary blood flow) [64].
Hyperemic MBF declines over the age of 65 years [64]. Using
15O labeled water, studies have shown that during
resting conditions, the MBF in the subendocardial layer is
approximately 35% higher than in the subepicardium [93]. During
hyperemia, augmentation of perfusion is greater at the
subepicardial level and the transmural perfusion gradient
diminishes, although the average subendocardial MBF remains
approximately 10% higher [93]. Using adenosine stimualtion, an
absolute MBF below 1.85-2.5 mL/min/kg is indicative of a
hemodynamically significant vessel stenosis [100].
Although there is a well known inverse relationship between the severity of coronary stenosis and flow reserve, there can be substantial individual variability due to varying degrees of adaptive vasodilator response and/or the presence of collateral flow [124]. Even for lesions between 70-80%, in about half of these cases no regional perfusion defects may be identified on myocardial perfusion imaging [124]. Myocardial (coronary) flow reserve can be used to better quantify the hemodynamic significance of a coronary stenosis, detect subclinical CAD, improve identification of balanced ischemia seen in severe three vessel disease [124,132]. The coronary flow reserve (CFR) is the ratio of myocardial blood flow at near-max coronary vasodilatation to basal myocardial blood flow (stress myocardial blood flow/rest myocardial blood flow) [64,135]. The normal myocardial blood flow reserve is approximately 3 mL/gm/min) [62]. The optimal cutoff between a normal and abnormal ratio is likely between 2 and 2.5 [82,100], although other authors indicate that a CFR < 1.5-1.7 is considered evidence of a significant stenosis or multivessel obstrctive CAD and places patients at high risk for adverse cardiovascular events [124,134] (other authors suggest < 2.0 is abnormal [132]). In general, hyperemic MBF and MFR are relatively preserved for coronary lesions with less than 70% angiographic stenosis or with preserved fractional flow reserve (FFR > 0.8) [134].
A decrease in coronary flow reserve can be due to narrowing of
the epicardial arteries, or, in
the absence of demonstrable coronary artery disease at
angiography, it may reflect dysfunction of the coronary
microcirculation [64] or microvascular disease. A preserved
MFR (>2.0) has an excellent negative predictive value,
and high risk CAD (left main and three-vessel disease) is
extremely uncommon with a MFR > 2.5 [134], while a
decreased CFR provides incremental diagnostic value (there is
a steady increase in cardiac mortality for MFR < 2.0)
[132,134]. Studies measuring myocardial blood flow reserve
have demonstrated higher rates of major adverse cardiac events
in patients with CFR's below 2.0 [82]. Cardiac mortality can
be as much as 5.6 fold higher in patients with the lowest
terile CFR (<1.5) compared to patients in the highest
terile [132]. A reduced CFR is associated with
cardiovascular events independent of lumenal severity on
angiography [132]. Even in patients with a normal
myocardial perfusion exam, impaired myocardial flow reserve on
PET is an independent predictor of cardiac death [91].
Diabetics without epicardial CAD, but with impaired CFR
have been found to have an annual cardiac mortality similar to
diabetics with known CAD [132]. Conversely, a normal CFR
effectively rules out high-risk CAD on angiography and confers
protection from a subsequent cardiovascular event even in the
presence of abnormal relative perfusion on MPS or a rest LVEF
< 40% [132]. In intermediate risk patients, use of CFR is
associated with a net reclassification improvement of 55%
[132].
To summarize [135]:
- Preserved global hyperemic MBF (>2 mL/min/gm) and global MFR > 2 reliably exlude high risk angiographic CAD.
- Severely reduced global MBR (<1.5) is associated with an increased likelihood of mulitvessel obstructive disease and should be considered a high-risk feature on PET imaging.
- Flow-limiting CAD should be considered in patients with normal PET MPI, but severely reduced regional hyperemic MBF (<1.5 mL/min/gm) and/or MFR (<1.5) in a single vascular territory.
There are certain patient popultions in which the use of MFR
can provide additional clinical information. Patients with
metabolic syndrome (abdominal obesity, hypertension, impaired
fasting glucose, and dyslipidemia) have also been shown to
have impaired CFR and there is a 2.6 fold increase risk of
coronary death among patients with metabolic syndrome (the
reduction appears to be related to an incease in resting MBF
that may be related to underlying HTN) [96]. In patients
with diabetes, incorporation of MFR can identify additional
high risk patients [134]. Myocardial flow reserve has also
been shown to be impaired in patients with chronic kidney
disease, possibly secondary to endothelial dysfunction [102].
MFR can be useful in identifying coronary allograft
vasculopathy in heart transplant patients [134]. CFR also decreases with increasing age
and is lower in obese patients [64].
Myocardial flow difference (MFD) is
defined as the difference between hyperemic MBF minus rest MBF
and therefore represents the absolute reserve or capacity of the
coronary circulation [82].
Relative myocardial flow reserve (also known as RFR) is
determined by the raio of hyperemic MBF within a specific
perfusion defect divided by hyperemic MBF in a remote, normally
perfused region of myocardium [135]. RFR is a regional measure
associated with a particular coronary distribution and can have
a value between 0.1 to 1.0 [135]. However, RFR may show
discordance with FFR as these measures are affected differently
by diffuse atherosclerotic or microvascular disease [135].
Fractional flow reserve (FFR): FFR
is a method used to measure the flow limitation at a particular
lesion [134]. FFR is calculated as the ratio of distal coronary
pressure and aortic pressure, typically measured using an
intracoronary pressure wire during adenosine induced maximal
hyperemia [134]. An FFR of more than 0.8 can be used to exclude
ischemia with a predictive value of over 95% [134]. However, FFR
has multiple limitations [134]. In the presence of serial
stenoses, a distal lesion artifactually reduces the pressure
gradient across the proximal lesion, leading to an
overestimation of the proximal lesions FFR, and thus
underestimates its functional significance [134]. Conversely,
the presence of a proximal lesion artifactually lowers the ratio
for the distal lesion [134]. Also- in the presence of diffuse
atherosclerotic disease, FFR may be abnormal, even without focal
stenosis [134]. Further, FFR assumes an intact microcirulation
and FFR can appear falsely normal in the presence of
microvascular dysfunction or disease [134].
The
ideal PET perfusion agent would be irreversibly trapped in the
myocardium in direct relation to perfusion and have rapid
blood clearance. The agents most commonly used for myocardial
blood flow determinations are 13N-ammonia (13NH3),
15O labeled water (H215O), and
82Rubidium [29]. Because of poor extraction at high
flow rates and relatively worse spatial resolution, 82Rubidium
provides the least accurate estimate of myocardial blood flow
[33]. 15O labeled water is theoretically superior to
13N-ammonia because it is a freely diffusible tracer
with virtually complete myocardial extraction that is nearly
independent of both flow rate and myocardial metabolic state
[33]. For 13N-ammonia, the extraction fraction from
the blood is lower than 100% and the extraction is inversely
related to the perfusion [75]. When 15O labeled
water is used, the myocardial blood flow (MBF) is estimated from
the tracer's washout from the myocardium, whereas for 13N-ammonia
the myocardial tracer uptake is used to determine MBF [33].
The initial minutes of a dynamic
acquisition are the portion of the exam that is used for
blood flow quantification. Because of the limited count rate
capabilities of PET scanners and varying tracer kinetics,
mathematic models must be applied for proper quantification
[29]. Methods have been developed to separate the delivery of
tracer to the heart (blood activity) from tracer retention in
the myocardium. To calculate the absolute blood flow, it is
necessary to obtain a dynamic series of measurements of the
blood pool concentration and the myocardial uptake [96]. This
can be obtained as either a dynamic framed data set or a list
mode study [96]. These dynamic acquisitions must be started
BEFORE the infusion of the PET tracer [96]. Ideally, the first
dynamic frame is free of any counts from the radiotracer [96].
Beginning the acquisition late can lead to an underestimation of
the blood pool concentration and thereby an overestimation of
the myocardial blood flow [96].
Myocardial
activity
is determined by a region of interest (ROI) placed over the
myocardial wall. Blood activity can be measured accurately by
direct sampling of blood from an artery, but this is invasive
and the sample would still require correction for time delays
and dispersion. Measurements performed from the reconstructed
PET images would be more practical and less invasive.
The most
accurate site to measure arterial blood pool activity is at
the level of the coronary ostia
at the base of the ascending aorta because this is the point
from which arterial blood irrigates the myocardial tissue.
Unfortunately, measuring activity from a ROI placed within the
ascending aorta is subject to error due to the limited
resolution of the imaging system, the small dimensions of the
aorta, and contamination from adjacent vascular and myocardial
structures. Thus, activity is usually measured from an ROI
placed within the left atria or left ventricle. The drawback
of a left ventricular ROI is that it is subject to motion
artifact as well as spillover activity from myocardial tissue.
A left atrial ROI tends to
closely match values obtained from direct arterial sampling,
however, it is often more difficult to identify the left atrial chamber on PET images. When
using a left atrial ROI it is
important to correct for the small time delay between the
arrival of the blood in the left atria and its actual arrival
in the myocardium or flow rates may be artificially elevated.
Data from the
myocardial and arterial ROI's can then be
used in various mathematical models that estimate MBF (in mL/min/gm). A single-tissue compartment model is
used for MBF determination when using 15O
labeled water [33]. When using 13N-ammonia, MBF is determined using a 3
compartment model describing the kinetics of the myocardial
metabolism and whole body metabolism of 13N-ammonia
[33]. A 2-compartment model is used for 82Rb,
however, the lower extraction fraction of 82Rb may
limit its value for flow quantification at high flow rates
[80]. In a two compartment model, K1 represents the initial
tracer uptake, K2 represents the tracer washout from the
myocardium, and K3 reflects retention of the tracer in the
myocardium (a single compartment model would encompass the
blood and the myocardial partition) [96]. The models also
include corrections for underestimations of tracer
concentration as a result of partial volume effects (due to
the limited spatial resolution of PET) and spillover from the
LV chamber into the myocardial ROI (due to motion of the heart
during contraction and respiratory cycles) [33]. Further
corrections have been developed to account for the variation
in myocardial extraction of 13N-ammonia with flow
and for the radiolabeled
metabolites of 13N-ammonia which accumulate in the
blood [33]. Automated programs are being developed for blood
flow determinations [83].
PET/CT and attenuation correction:
Previously, attenuation correction of myocardial imaging was performed with a 68Ge transmission source [31]. The typical radiation dose from a 68Ge transmission scan was about 8 mrem (0.08 mSv) [45]. Newer PET/CT scanners use CT for attenuation correction and this has also been shown to provide accurate results for qualification and quantification of myocardial perfusion [31]. A low dose CT used only for attenuation correction results in a radiation dose of about 80 mrem (0.8 mSv) [45]. Following completion of the PET study, a coronary CT angiogram can be performed [52]. By coupling the perfusion exam findings to a coronary CTA study, PET/multi-detector CT permits the fusion of anatomic and functional information [37,39]. The fused exams can accurately measure the atherosclerotic burden and identify the hemodynamic functional significance of coronary stenoses [37,39]. The results of the combined exams can more accurately identify patients for revascularization [39]. CTA imaging should be performed following the PET study to avoid potential interference from beta-blockers used for heart rate control [52]. The radiation dose to the patient from combined coronary CTA and PET rest-stress myocardial perfusion imaging is between 10-12 mSv [39].
Both rest and stress exams should have separate CT transmission scans for attenuation correction [52]. For stress images, the best attenuation correction results are usually obtained with post-emission scanning (i.e.: following completion of the PET stress exam) [52]. The effects of the vasodilator stress have usually passed by this time and patients are more comfortable and less likely to move [52]. Some authors suggest using a single post stress cine CT for attenuation correction of both the stress and rest exams in order to decrease patient radiation exposure [63]. This requires manual shifting of the attenuation data set to eliminate misregistration [63].
When using CT for attenuation
correction of PET images, certain limitations exist.
1- Respiratory motion: Respiration
causes the heart to move up by as much as 1.6 cm- which is about
the thickness of the heart wall and this will blur the PET image
[54]. Previously, transmission data sets were acquired using a
germanium source. As with the emission data set, the
transmission scan was acquired over several minutes and the two
blurred data sets would then be closely matched (if the patient
did not move between acquisitions) [53]. With CT for attenuation
correction, the CT exam freezes respiration at a single point in
the respiratory cycle, while the PET emission data is still
acquired over several minutes [48]. Misalignment between the CT
and PET data sets can be observed in 45-60% of rest exams and
49-67% of stress exams [122]. If the PET and CT data sets
are not properly aligned, respiratory effects can introduce
large inhomogeneities in apparent
myocardial uptake (up to 30% decreased or increased activity
compared to actual uptake) [48,53]. This is particularly
problematic for the lateral and anterior walls of the left
ventricle as the myocardium has a boundary with the lung and a
few millimeters of respiratory motion can easily make the
myocardium in the emission data appear in the lung field of the
CT data resulting in improper attenuation correction (the
myocardium in the portion of the lung will be undercorrected due to differences in
attenuation factors between the heart and lung- an
underestimation of the attenuation) [48,49,51,54,56,110].
This
results
in an apparent decrease uptake in the anterior or lateral wall
(areas of artifactual hypoperfusion) [86,110]. As little as 1 cm
of misregistration can introduce a 10% drop in lateral wall
counts [96]. Misalignment of more than 6 mm can produce
noticeable effects, but the greater the degree of misalignment,
the more conspicuous the defects (in general- motion of 6-8mm
produces mild to moderate errors, but motion over 8 mm can lead
to severe errors that may affect the clinical interpretation)
[49,56,86]. In one study, misregistration
of more than 6 mm resulted in artifactual
PET defects in up to 40% of patients, and these defects were
moderate to severe in 23% [56]. In up to 18% of patients,
perfusion defects can completely disappear following
reprocessing with manual registration of the PET and CT data
sets [49]. The septal and inferior
walls are in contact with other soft tissue structures so that a
misalignment will produce only minor changes in the attenuation
factors for these segments [49].
In addition to perfusion defects,
misregistration can also result in errors in both regional and
global quantification of myocardial blood flow [110].
Misregistration by 10 mm can result in a decrease in global MBF
of 24% (17-31%), and a decrease in MFR of 23% [110]. Even 5 mm
of misregistration can result in a decrease in global MBF of
between 5-14% [110]. Misregistration in the opposite direction
results in overestimation of MBF [110].
Various methods have been proposed to correct the problem of mis-registration between the PET and CT data sets-
A. End-expiration CT imaging: Mis-registration and variation have been shown to be minimized when CT images are acquired at end-expiration [48].
B. Respiration-averaged CT or ultraslow CT acquisition [49,51,54] have been shown to be superior to end-expiration CT. However, even when the CT scan is acquired during shallow respiration almost half of the PET scans can be misaligned by greater than or equal to 5 mm [68].
C. Gating- The most eloquent way to correct for respiratory motion is to gate the CT to the respiratory cycle and then average the respiratory gated data to match the ungated PET data [51]. Alternatively, the both the PET emission scan and CT could be acquired with respiratory gating- the attenuation corrected data at each phase of the respiratory cycle would be matched to the emission data from the corresponding phase [51]. However, this type of phase matched acquisition would require a large amount of data processing and would be difficult to implement clinically [51].
D. Cine CT/free breathing- A cine CT exam is acquired during the duration of a respiratory cycle to create a respiration-blurred CT scan that is used for attenuation correction [68]. However, up to 19% of patients may still require manual registration of the PET and cine CT data set to ensure proper attenuation correction [56]. The intensity-maximum cine image seems to be the best for improving attenuation correction and has been shown to be superior to end-expiration CT. [53]. The cine CT exam exposes the patients to additional radiation (about 2 mSv when acquired using 10 mA and 140 kVp for approximately a 6 sec acquisition) [53].
F. Shallow-free breathing: The patient is allowed to breathe throughout the CT scan using small breaths [96].
E. Gated PET- a respiratory gated PET scan can be performed and separately aligned to the CT image at each phase of the breathing cycle [86].
2- Metallic artifacts: Metal associated with cardiac pacers and implantable defibrillator devices can produce image artifacts on cardiac PET/CT imaging [38]. Most metals exhibit strong photoelectric absorption of x-rays, but interact with 511 keV gamma rays primarily via Compton scattering [38]. The CT attenuation correction scaling algorithm does not account for this effect and causes overcorrection of the PET images (i.e.: it produces a "hot" spot) [38]. Overcorrection is not a signifnicant problem with conventional PET scanners that use 68Ge/68Ga or 137Cs transmission sources with gamma energies of 511 keV and 662 keV, respectively [38]. Defibrillator leads can be particularly problematic if they are placed in close relationship to the left ventricle (typically within 15 mm) [38]. Falsely elevated FDG uptake of 44-81% be seen at the lead location [38]. This focal area of increased activity can mask a perfusion defect and can also interfere with image normalization (i.e.: the remainder of the myocardial segments can appear to have less tracer uptake) [38]. Pacemakers produce a more moderate focal abnormality [29,38]. A segmented reconstruction algorithm or software based metal artefact reduction for the CT scan may help to overcome artifacts from metallic implants [52,116].
Radiopharmaceuticals/Technique
for perfusion imaging
Agents used for PET myocardial perfusion imaging include 13N-ammonia, 15O-water, Rubidium-82, and 62Cu -PTSM. Agents labeled with 18F (such as 18F-fluorodihydrorotenone) are being developed for clinical use [36].
13N is cyclotron produced by either irradiating methane gas with deuterons [12C (d,n) 13N] or by the reaction 16O (p,alpha) 13N with water as the target. 13N has a physical half-life of 10 minutes. Its positron range is only 0.4 mm which results in excellent images [44] (other authors suggest a longer positron range of 2.5 mm for 13N [133]). There is rapid blood clearance with high initial extraction (80-90%; compared to approximately 54% for Tc-tetrofosmin and 60% for Tc-sestamibi) and high tissue retention (80%), which provides high myocardial to background count ratios [81,119,132]. The agent readily diffuses across plasma and cell membranes [52], although the exact mechanism of intracellular transport remains unclear [44]. Tracer uptake in the lungs is usually minimal, but lung activity can be increased in smokers and in patients with congestive heart failure and this can interfere with imaging [29,52,95]. In these patients, it may be necessary to increase the time between injection and imaging to improve myocardial to background activity [52]. Liver uptake can also be problematic [29,52].
Inside the myocyte the agent is
metabolized to 13N-glutamine via glutamine synthetase and becomes unable to leave
the cell (only a small fraction diffuses back into the
intravascular space) [44,52].
Extraction of the tracer generally reflects regional perfusion,
however, extraction is non-linear and decreases at high flow
states (to as low as 35%) and plateaus at flow rates greater
than 2 mL/min/g [29]. This leads to
underestimation of flow at high flow rates [52]. According to Di
Carli- the first pass extraction of
the agent is 83% when blood flow is 1mL/min/g and decreases to
69% at a flow of 3mL/min/g [52]. Di Carli
also states that extraction is linear for flow rates below 2.5 mL/min/g [52]. At the higher flow rates
"metabolic trapping" of the agent becomes the rate limiting
factor affecting tracer retention [52]. Another consistent
finding is low uptake of the tracer in the lateral/posterolateral wall (about 10% reduction
even in healthy subjects) on both stress and rest images which
appears to be related to a regional alteration in 13N
tissue metabolism/retention [3,40,52]. This defect is not
detected on dynamic imaging, which can be used to differentiate
a true perfusion defect from artifact [4].
The critical organ for N-13 is the urinary bladder. The typical dose used for imaging is 10 to 15 mCi I.V. given over a 20 to 30-second interval. Di Carli recommends using a lower activity for the rest exam (about 10 mCi) and a higher activity for the stress study (about 30 mCi)- this avoids having to wait for the rest dose to decay to background levels prior to performing the stress exam [52], but this will result in higher radiation exposure. Imaging is usually started 3-5 minutes after injection of the tracer to permit pulmonary background activity to clear and the scan duration is about 20 minutes [52]. Images should be acquired in a decay compensated mode. Because the agent has a 10 minute half-life, post-treadmill exercise is feasible [44]. For a typical rest-stress 13N exam the effective radiation dose is about 2.2 mSv to 6 mSv [43,117] (1.5 mSv effective dose for 1 10.o mCi rest and stress dose [99]). Images can be gated to provide assessment of regional and global cardiac function [52]. A FDG exam may be performed after a 50-minute interval to permit decay of the N-13 to background levels. Quantification of blood flow can be performed with 13N-ammonia and has been well validated [52]. Determination of myocardial perfusion reserve has been suggested to be a more sensitive predictor of myocardial death than LVEF in patients with ischemic heart disease [70]. When using 13N-ammonia PET for flow quantification, in patients with normal perfusion, an abnormal coronary flow reserve was associated with a higher annual event rate over 3 years compared to patients with a normal CFR (6.3% versus 1.4%) [80].
15O is cyclotron produced by the irradiation of nitrogen [14N (d,n) 15O or 15N(p,n)15O] and it has a physical half-life of only 2.2 minutes (123 seconds). O-15 produced in the cyclotron is converted to [15O]CO2 by passing it over activated charcoal at 400 to 600 degrees Celsius. [O-15] water is then prepared by bubbling the [15O]CO2 into water. Theoretically, 15O water is ideal for quantitative regional myocardial flow measurements (in ml/min/gm) for two reasons: it is a freely diffusible perfusion tracer with 100% extraction by the myocardium [29], and it is not affected by metabolic factors. The positron range is about 1.1 mm [44] (other authors suggest a longer positron range for 15O of 4.1 mm [133]).
Because the agent is freely diffusible across capillary and cell membranes the extraction of 15O-water (H215O) remains linear even at very high flow rates (it is the only perfusion tracer with linear extraction- meaning its accumulation in tissue is almost exclusively a function of blood flow [44]) and, therefore, myocardial distribution of the agent reflects regional perfusion [81]. 15O-water is considered to be the most accurate PET flow tracer [81]. Unfortunately, image quality is not as good as that obtained with other flow agents because tracer circulating in the blood pool remains within the ventricular chamber and must be subtracted in order to visualize the myocardium [95]. This can be done by use of a separate administration of O-15 carbon monoxide to label erythrocytes or by the use of an early image (20-40 seconds after the administration of O-15 water) which would represent a vascular image before significant activity reaches the coronary arteries [29].
For myocardial perfusion quantification, dynamic scans are obtained for up to 5 minutes after bolus administration of 15-25 mCi [29]. For a typical rest-stress H215O exam (2 x 740 MBq) the patient effective radiation dose is about 1.4 mSv [43].
Rubidium-82 (82Rb) is a generator produced
positron emitter. Rubidium-82 has a physical half-life of only
75/76.4 seconds. The agent is produced from a Strontium-82
generator (T1/2=25.5 days) which decays by electron capture to 82Rb. The column is conditioned to bind Sr, but not Rb
[81]. Flushing with physiologic 0.9% saline removes 82Rb activity in the eluate,
while Sr remains bound to the
column [81]. The generator can be eluted with a
greater than 90-95% yield every 6-10 minutes [52,81]. Generators are typically supplied
with 3700 MBq (100mCi) of 82Sr
which enables regular elution of 40-60mCi of 82Rb over the useful life of the generator [81]. The
generator can be used for about 1 month [44]. A disadvantage of
Rubidium is the reduction in counts during the 4th week of the
generator that may result in loss of image quality [77]. It is
generally advised that very obese patients and patients with LV
failure be avoided during the 4th week [77]. Monitoring for 82Sr
and 85Sr breakthrough is important for quality
assurance and as the generator is used the amount of these
contaminants in the eluate increases [131]. The manufacturer
requires increased monitoring after 14L of eluate volume is
drawn from the system and discontinuance of use of the generator
after 17L [131].
Rubidium-82 is a potassium analog and tissue uptake requires an active Na/K-ATPase pump for intracellular transport [44]. Myocardial ischemia and reperfusion reduce the uptake of Rb-82 due to a reduction in cellular transport [29]. This reduction in extraction occurs even after only short periods of transient ischemia [29]. 82Rb has the worst resolution of all the positron emitting agents- this is because of it's high positron energy (1.52 MeV) which results in a mean range of about 5.5 mm (2.8-12.4 mm) prior to undergoing an annihilation [44,46,133]. Additionally, 13-15% of 82Rb nuclear decays are associated with a 776 keV prompt gamma emission [79,81]. This high energy photon can be scattered and recorded as a coincidence with one of the 511 keV annihilation photons [79,81]. The likelihood for a coincidence is small when 2D imaging is employed, however, it could be more of a problem with 3D scanners due to the wide axial acceptance angle [79].
The short half-life of the agent allows for rapid repeat
imaging and blood flow measurements in
short time intervals, but requires the use of large
doses of the tracer. Repeat imaging of the same patient can be
performed after only 6 minutes since the background activity
from the previous scan has decayed to below 5% [81]. The short
half-life and scan times permits rapid rest and stress imaging
which can be completed in 30-45 minutes- which is convenient for
the patient and permits high-throughput imaging [115].
However, the short half-life of the agent has some negative effects as well. First- it is crucial to wait for 82Rb to clear from the blood pool prior to imaging because 82Rb counts in the cavity could scatter into subendocardial defects and obscure them [43]. The time required for clearing of 82Rb from the cardiac blood pool is inversely related to the cardiac output and directly related to the circulation time [43]. Therefore, following injection imaging must be delayed for at least 2 minutes to permit clearance of blood pool activity and considerable decay of the tracer occurs during this time. Also, due to changing myocardial activity from decay, imaging times must be short to prevent back-projection reconstruction artifacts- this results in low count images. The relatively low count density requires more reconstruction smooth, producing images with lower spatial resolution [81]. Another drawback of the agent is that myocardial single-capillary transit extraction of the agent is low- about 50-70% at rest [52,81] and this further decreases at high flow rates to only 25-40% resulting in a leveling off of extraction [81,88]. However, other articles suggest higher extraction of 82Rb by the myocardium and that uptake is more linearly related to increases in coronary blood flow than Tc-99m SPECT agents [46,108]. The tracer reaches a constant level in the myocardium approximately 1.5-2 minutes after injection [81].
Infusion system: As a result of it's short half-life, the 82Rb eluate must be infused directly into the patients intravenously using a dedicated infusion system [81]. The system consists of a sterile saline supply that is flushed through the generator and into the patient via a sterilizing filter [81]. A computer system monitors the activity eluted from the generator using a radioactivity counter on the patient outlet line and stops the elution when a preset activity has been delivered to the patient [81]. A generator bypass line enables flushing of all activity from the patient IV tubing at the end of the elution, thus removing residual activity outside the field of view that could contribute to image scatter and detector dead-time - particularly with 3D acquisitions [81,83].
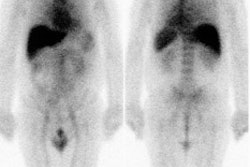
|
Rb-82 rest perfusion examination |
|
|

Radiation dose:
The effective dose is on the order of 0.75mSv/GBq- the low effective dose is expected
largely due to the ultra-short half-life of 82Rb [81]. For a typical rest-stress exam the
effective patient dose is about 302-500 mrem
(2 to 5.4 mSv) [43,46,92,95,107,109,117] to 1.6 rem (16 mSv)
[45,87]. The dose is lower or similar to that associated with
rest-stress Tc-99m perfusion imaging 11-18 mSv
[46,107]. The use of 3D acquisition can decrease the amount of
tracer required for the scan by half, and thereby halves the
patient effective dose [81]. The total effective dose for a
combined rest-stress 82Rb MPI + MBF scan with 3D PET is in the
range of 1-2mSv for a typical injected activity of 10 MBq/kg (750-1500 mBq
or 20-40 mCi) [81]. On rest
imaging, the critical organ is the kidney, followed by
the heart wall [87]. For stress imaging, the highest mean
organ-absorbed dose is the heart wall (5.1 μGy/MBq), followed by the kidneys (5.0 μGy/MBq)
[88]. Estimated effective radiation doses from PET perfusion
exams are shown below (from [80,88]):
|
Test |
Radiation dose (mSv) |
|
82Rb (rest
+ stress) |
3.3-3.8 [88] to
12.6-13.5 [80] |
|
13N-ammonia (rest + stress) |
2-2.3 |
|
15O-water |
1.6-2.3 |
|
Scout/localizing CT |
0.04 |
|
CT attenuation
correction |
0.3-0.35 |
|
Ca scoring (prospective
gate) |
1.5-3 |
Exam protocol:
Rest imaging should be performed prior to stress imaging to
reduce the impact of residual stress effects such as myocardial
stunning which can affect Rb-82 extraction [27,29]. One
drawback of PET perfusion imaging is that it requires the use
of pharmacologic stress to detect abnormalities in flow
reserve [61]. Unfortunately, in patients with CAD, coronary
vasodilator reserve is often abnormal, even in territories
supplied by non-critical stenoses
thereby reducing the heterogeneity of flow between normal and
abnormal zones and limiting the ability to delineate the
presence of multivessel CAD [61].
Pharmacologic stress using dipyridamole is presently used for 82Rb imaging [42,46].The longer duration of hyperemia with dipyridamole enables acquisition of three separate image sets- transmission, emission (for older PET scanners), and ECG-gated [46]. Following the exam, aminophylline 100 mg can be administered to reverse the effects of dipyridamole [46]. The selective A2a receptor agonist regadenoson offers advantages over dipyridamole as it is given as a single bolus and does not require a continuous infusion and lengthy tubing to administer [112]. However, the more limited peak pharmacologic effect (peak hyperemia is maintained for about 2.3 minutes) may affect the ability of the agent ot be used effectively with Rb-82 due to the agents short half-life [112]. In fact, when following manufacturers recommendations, regadenoson has been shown to achieve only 80% of the maximal hyperemia attained with dipyridamole [130]. The optimal delayed between regadenoson and tracer injection has been suggested to be 65-70 seconds resulting in an increase in hyperemia to 90% of that achieved with dipyridamole [130]. However, ragadenoson stress has been shown to be accurate for the detection of obstructive CAD with a sensitivity of 92%, a specificity of 77%, and a normalcy rate of 97% [112]. Stress only imaging has been suggested in certain patient populations (low pretest likelihood for CAD) in order to reduce radiation exposure [114].
On SPECT pharmacologic imaging, ST segment depression during vasodilator infusion has been shown to be associated with an increased risk for subsequent cardiac events even when perfusion imaging was normal [42]. However, a normal 82Rb stress exam confers an excellent prognosis even when ST segment depression is noted [42].
The typical dose for the 82Rb perfusion exam is 40 to 60 mCi (1.48-2.22 GBq) infused over 20 to 30 seconds [27,46,52]. In patients with normal LV function, imaging is usually begun 60-70 seconds (Di Carli recommends 90 sec in healthy individuals) after the infusion is complete to permit clearance of blood pool activity. Imaging is delayed to 90-120 seconds following completion of the infusion in patients with poor LV function (LVEF less than 30%) or RV systolic function [27,52]. About 80% of the useful counts are acquired in the first 3 minutes of imaging, and 95% in the first 5 minutes [27]. Quantification of MBF requires dymanic PET imaging from the start of tracer injection for at least 2 minutes [81].
For a standard 2D acquisition 82Rb cardiac images tend to be count poor due to the agents short half-life [26]. 3D imaging has a higher sensitivity, however, it suffers from greater scatter, random events, and saturation which can paralyze a system [26]. One method to avoid detector saturation is to lengthen the duration over which the activity is administered allowing the camera to remain in a more linear range throughout the acquisition [81]. Further work needs to be performed to determine optimal 3D myocardial perfusion imaging [26].
Results/Prognosis:
Compared to SPECT imaging, PET imaging with Rb-82 has been shown to be more accurate (87-90% versus 71% for greater than 50% vessel stenosis), to have fewer artifacts (due to lower bowel and liver activity which affected only 5% of PET studies, but 41% of SPECT exams), improved normalcy rates, and to produce overall higher quality examinations which results in a higher diagnostic confidence (i.e.: a greater number of definitively normal or abnormal exams) [46,80,85,95,115]. PET imaging was also superior for localizing disease to individual coronary arteries [46]. Identification of multivessel CAD is also superior with PET imaging [46]. The average weighted sensitivity for detecting at least one coronary artery with more than 50% stenosis is 90% (range 83-100%), whereas the average specificity is 89% (range 73-100%), the average PPV is 94% (range 80-100%) and the average NPV is 73% (36-100%) [95]. As with SPECT imaging, the extent and severity of stress perfusion defects correlate with an increased risk for cardiac events and mortality [52,73,74]. Preliminary data indicate that a normal PET exam is associated with a very good prognosis and a low cardiac event rate (0.4-0.9% rate of MI or cardiac death) [52,76,85,107]. Whereas, annual cardiac event rates can be 2.3-5.5% for patients with mild ischemic stress findings and 7.0-11.5% for patients with moderate to severe findings [74,76,107].
The use of PET may also aid in reducing overall health care costs- in one study, the use of PET perfusion imaging in patients with an intermediate probability for coronary artery disease was found to reduce the use of invasive coronary angiography by over 50% (a 30% cost savings) [55]. This was felt to be related to the improved specificity of PET compared to SPECT imaging (false positive exams decreased from 15.6% with SPECT to 5.2% with PET) [55].
However, a normal stress perfusion PET study is an overall poor
discriminator of patients without non-flow limiting
(subclinical) coronary atherosclerosis [60,61].
Up to 50% of patients with normal PET perfusion imaging are
found to have some degree of CAD by CTA [60]. Therefore, CTA
imaging plays a complimentary role to PET perfusion imaging by
permitting identification of pre-clinical CAD that can be
treated with aggressive medical treatment and life style modification [60]. Even coronary
calcium scoring can add additional prognostic information to the
PET scan results [61,80]. Studies
have demonstrated a stepwise increase in cardiac event rates
with increasing CAC score for any level of perfusion abnormality
[61,80,87]. In fact, increasing CAC
score was associated with an increased cardiac event rate even
without the presence of ischemia on PET perfusion imaging (i.e:
a normal perfusion exam) [61]. In patients with normal PET
perfusion exams, the annualized event rate for patients with a
CAC score of zero ranged from 0.7-2.4%, while the rate was 3-11%
for patients with a CAC score above 400 [95,107]. For patients
with ischemia on PET perfusion imaging, the event rate has been
shown to be 8.2% for those without CAC, and over 20% for those
patients with a CAC score over 1000 [87]. The wide range of
event rates was related to evaluation of both symptomatic and
asymptomatic patients [95].
Fused perfusion PET and CT coronary angiography imaging can also be used to better delineate at risk myocardium due to the inherent anatomic variability in the coronary arteries [78].
|
|
|
Reproduced from [61]. x-axis indicates CAC score; y-axis indicates annualized event rate (%/yr) |

Quantitative evaluation:
Blood flow:
Balanced ischemia associated with 3-vessel CAD may not produce evident perfusion defects. Up to 40% of patients with 3-vessel CAD may not demonstrate other high risk findings on perfusion imaging such as ischemic ECG changes, TID, or decreased LVEF reserve < 0% [104]. Determination of the myocardial flow reserve is important because it may be impaired by both macroscopic flow-limiting three vessel disease (balanced ischemia), as well as coronary microvascular dysfunction [90,103,104] (coronary CTA would be required to distinguish between the two [105]). Another group that can benefit from quantification is patients with multivessel disease in whom the presence of CAD is detected on qualitative analysis, but only the most severe region is considered pathologic [103]. This is easy to understand because the region with the best perfusion is consdered "normal", but this may not be the case in patients with multivessel CAD [103]. A regional quantification would premit detection of compromised perfusion in those apparently "normal" regions [103]. Finally, quantification would also permit identification of patients with high MBF in the normal range, but inhomogeneous tracer uptake that could be erroneously interpreted as perfusion defects [103].
Quantification of blood flow can be performed with Rb-82 using a two compartment model [80], but it is challenging because of the agents physical properties (short half-life and longer positron range that degrades image resolution) and nonlinear lower extraction fraction at high flow rates [52,90,103,104]. In one study, 82Rb flow estimates correlated well with 13N-ammonia flow estimates for flow values that ranged from 0.5-2.5 mL/g/min [72]. A small overestimation was noted for resting MBF, and an underestimation of stress MBF [72]. The inaccuracies in the estimation of MBF with 82Rb may be related to the lower extraction of the agent, as well as the difficulties in modeling the agent and lack of modeling of venous egress [72]. Because true determination of absolute perfusion is complex and time consuming, balanced 3-vessel ischemia may still not be readily apparent even in perfusion PET imaging.
None-the-less, globally impaired flow reserve (CFR <2) on 82Rb PET is an independent marker for predicting an increased risk for cardiovascular events, even when the perfusion scan appears normal [90,95,97,103,104,108]. The event free survival has been reported to be 97.1% for patients with a normal myocardial flow reserve, compared to 77.3% in patients with abnormal MFR [107]. In patients with normal stress PET exams, another study reported an annual cardiac event rate of 3.6% in patients with a normal MFR, compared to 10.5% for an abnormal MFR [107]. In another study, a low flow reserve (<1.5) was associated with a six-fold increase risk of cardiac death [123]. A preserved myocardial flow reserve makes the presence of 3-vessel CAD very unlikely [104]. One point that is important to note is that myocardial perfusion quantification cannot differentiate decreased perfusion due to epicardial coronary artery stenosis and that secondary to microvascular dysfunction [95].
Summed Stress Score:
Quantitative analysis of the PET exam using SSS can also provide prognostic information [74]. Annualized all-cause mortality rate has been reported to be 2.4% for SSS 0-3, 4.1% for SSS 4-8, and 6.9% for SSS > 8 [74].
LV function:
Unlike SPECT imaging which is performed in a delayed manner, 82Rb PET enables measurement of LV function during peak pharmacologic hyperemia [50,97]. Global LV function can be evaluated with gated Rb-82, however, when compared to CT ventriculography, the calculated EF appears to be underestimated [65]. This is likely the result of underestimation of EDV from the count poor end-diastolic frames [65]. During diastole, the LV wall is thinner [65]. Because of partial volume effects, the count poor Rb-82 images appear noisier and more heterogenenous and this impairs proper contour detection [65]. A low number of gated frames (8) also likely contributes to a decrease in the measured LVEF [65]. Unfortunately, sampling more than 8 gates is not practical for Rb-82 because of the low number of counts per frame [65].
Even with pharmacologic stress, LVEF increases during vasodilator stress in normal patients [52,80]. A reduced subendocardial flow reserve or a coronary steal in patients with multivessel disease can lead to myocardial dysfunction with pharmacologic stress and changes in the LVEF [50,65,113].
Peak pharmacologic stress PET LVEF has been shown to provide additional prognostic information over stress perfusion PET imaging alone with reduction in LVEF leading to progressively higher annualized mortality rates [52,69,97]. In one study, a stress LVEF of less than 50% was associated with an annualized mortality rate of 8.2% (compared to 2.4% for individuals with LVEF >50%) [69]. Integration of the LVEF with sum stress score data further enhances risk stratification [69]. Even for patients with normal perfusion (SSS 0-3), in one study the annualized mortality rate increased from 2.4% to 4.2% (for LVEF 40-49%) and to 7.1% if the LVEF was less than 40% [69].
Other authors have evaluated LVEF reserve (the difference between the stress LVEF and the rest LVEF) and this has also been shown to provide incremental prognostic information [76,77]. A LVEF reserve < 0 (a decrease in LVEF between rest and peak stress) has been associated with a higher annualized cardiac event rate [76]. A decrease in LVEF of more than 5% during pharmacologic stress can be seen in patients with severe multivessel CAD, decreased coronary flow reserve, and coronary steal (coronary steal is suggested by a CFR of less than 1.0 in a coronary distribution [113]) [50,113]. Conversely, an increase in LVEF of more than 5% has a very high negative predictive value for excluding the presence of severe left main or 3-vessel CAD (i.e.: the negative predictive value of a greater than 5% increase in LVEF between rest and stress to exclude the presence of 3-vessel or left-main disease is 97%) [50,80]. LVEF reserve during regadenoson stress has also been shown to be inversely related to the magnitude of reversibility and magnitude of jeopardized myocardium [112].
Transient LV dilatation:
A value of greater than 1.13-1.15 is
considered to represent an abnormal TID ratio for 82Rb PET myocardial perfusion imaging [101]. An
abnormal TID ratio on 82Rb PET perfusion imaging is associated
with more extensive LV dysfunction, ischemic compromise, and
reduced global flow reserve [101]. Even in patients with no
regional perfusion abnormalities, an abnormal TID ratio is
still associated with an increased risk of death (and these
patient are frequently shown to have a decreased myocardial
flow reserve) [101].
Mechanical dyssynchrony:
Phase
analysis/mechanical dyssynchrony can also be determined on PET
myocardial perfusion imaging [106,127]. The phase histiogram
bandwidth is the range in degrees during which 95% of the
myoacrdial voxels initiate contraction [128]. The phase
standard deviation is the standard deviation (in degrees) of
the timing of contraction from all the myocardial voxels
[128]. In one study of patients with known or suspected
coronary artery disease, one-third of patients with normal
bandwidth and no asynchrony at rest, developed prolonged
bandwidth to the abnormal range with pharmacologic stress
[127]. In heart failure patients (LVEF <35%) with
underlying ischemic cardiomyopathy, worsening mechanical
dyssynchrony with pharmacologic stress has been shown to be an
independent predictor of all-cause mortality [106]. PET 82Rb myocardial imaging has also
demonstrated that LV asynchrony is a complex process and that
up to 20% of patients with asynchrony at rest have been shown
to have normalization of bandwidth with pharmacologic stress,
possibly related to improved myocardial blood flow homogeneity
due to higher coronary flow reserve and higher stress
myocardial blood flow and lower coronary vascular resistance
[127,128].
Copper 62 PTSM: Copper-62-Pyruvaldehyde-bis-(4N-thiosemicarbazone)
Cu-PTSM is a generator-produced tracer which can also be used for myocardial perfusion imaging. 62Cu has a physical half-life of 9.7 minutes. The short half-life of the parent isotope 62Zn (9.3 hours) limits the practical life of the generator to 1 to 2 days. However, once loaded, the generator can be eluted every 30 minutes. The positron range is 2.7 mm [44].
62Cu -PTSM is a neutral, lipophilic
tracer that is taken up in tissues and then trapped intracellularly by reduction to a non-lipophilic compound. There is non-linear
extraction of the tracer (ie:
extraction decreases at high flow rates [95]) and high liver
activity which scatters into the inferior wall. The agent also
binds to human albumin which precludes accurate recording of the
arterial input function which is critical for quantification.
[5] The recommended dose is 0.12-0.2 mCi/kg
as an intravenous bolus followed by dynamic imaging for 10-15
minutes [44].
F-18 labeled perfusion tracers
F-18 label perfusion tracers are being developed to permit for delayed imaging following exercise stress [98]. F-18 flurpiridaz is an agent that is a structural analog of pyrideaben and it binds to mitochondrial complex I with a high affinity and retention [98,108]. Cardiac uptake is proportional to flow even at high flow rates and the agent does not undergo significant redistribution [108]. The extraction fraction is greater than 90% which should permit detection of milder perfusion abnormalities associated with lesser degrees of coronary stenosis [98]. F-18 flurpiridaz has been shown to have significantly higher diagnostic accuracy compared to SPECT imaging [119]. Additionally, F-18 flurpiridaz has lower radiation exposure (6.2 mSv) compaerd to one day sestamibi MPI (13.3 mSv) [119].
PET
Metabolic Imaging
There are numerous clinical applications for PET metabolic myocardial imaging. One of the most recognized applications is for the assessment of viable myocardial tissue. As with perfusion, myocardial metabolic functions can also be quantified by PET imaging.
Physiology
of metabolic myocardial imaging:
The heart can oxidatively metabolize a variety of substrates to meet its high energy needs. Under post-prandial conditions, plasma insulin levels rise, peripheral lipolysis is inhibited, and there is increased myocardial glucose metabolism [41]. In the fasting state (low insulin levels, increased lipolysis in peripheral adipose tissue, and high circulating free fatty acids [41]) the myocardium preferentially utilizes fatty acids and lactate as aerobic substrates to provide the energy (ATP) necessary for contractile function (unlike other cells in which glucose is the most important substrate). In plasma, fatty acids are transported bound to albumin and enter the myocardial cell either by passive or active transport. Once in the cell, fatty acids undergo oxidative metabolism. Although fatty acids are the preferred myocardial energy substrate, even in the fasting state glucose utilization is variable and can still account for 30-40% of the energy derived from oxidative metabolism [15]. Additionally, there is an age-related decrease in fatty acid metabolism and a relative increase in glucose metabolism in healthy older individuals [41].
Fatty acid beta-oxidation occurs in the mitochondria and is very sensitive to oxygen deprivation. When blood flow is significantly reduced (i.e.: during ischemia), tissue delivery of oxygen and removal of waste products are also reduced. As a result, oxygen dependent substrate catabolism decreases. Since fatty acids are catabolized by beta oxidation, fatty acid consumption ceases with anoxia (i.e.: a depression of fatty-acid extraction and oxidation will occur rapidly in zones of myocardial ischemia or infarction) [66,67]. This decrease in fatty acid utilization is followed by an increased glycolytic flux with glycogen depletion and increased exogenous glucose utilization (glycolysis can supply adenosine triphosphate in the cytoplasm under anaerobic conditions) [66]. Decreased fatty acid uptake and increased glucose uptake is the metabolic signature of ischemic myocardium [71]. The ischemic induced switch to glucose metabolism can persist for up to 24 hours or longer- even after restoration of blood flow [66,71]. A differential uptake in FDG between normal and ischemic myocardium can be used for hot spot imaging of myocardial ischemia [67]. Some authors have suggested that the metabolic signal of increased glucose utilization is better for detecting myocardial ischemia than perfusion imaging [66]. In one study comparing myocardial stress-rest perfusion imaging with FDG imaging, in patients with stenoses greater than 70%- 61% demonstrated increased FDG uptake, but only 39% had reversible perfusion abnormalities [66]. In another study, 67% of the coronary territories supplied by >50% stenoses had abnormal metabolism on post-stress imaging, but only 43% of the vascular territories demonstrated totally or partially reversible perfusion defects on Tc- Sestamibi imaging [71]. One drawback of FDG imaging is that it may be difficult to resolve and conclusively localize the hot-spot FDG signal when the remainder of the myocardium shows little or no tracer uptake [66].
As previously discussed, during periods of ischemia or hypoxia the myocyte compensates for the loss of oxidative potential by shifting toward glucose utilization to generate high-energy phosphates [41]. Unfortunately, the amount of energy produced via glycolysis may not be sufficient to sustain mechanical work, but it can be adequate to maintain cell viability--this condition is referred to as hibernating myocardium. Glycolysis can only be maintained if lactate and hydrogen ions (the byproducts of glycolysis) do not accumulate intracellularly. Therefore, blood flow must be sufficient to deliver glucose to the cell and remove the metabolites of the glycolytic pathway. Once perfusion is decreased below a critical level, the tissue concentrations of lactate and hydrogen ions will increase and inhibit glycolysis [14]. This results in a loss of ion concentration gradients across the cell membrane, followed by cell membrane disruption, and cell death [14].
PET Metabolic Myocardial
Imaging using 18F-2-Deoxyglucose (18-FDG) and exam
technique:
18F-2-deoxyglucose is one of the agents used for cardiac metabolic imaging. Fluorine-18 has an effective half life of 110 minutes. It is produced by bombarding 18O with protons and displacing a neutron [18O (p,n) 18F]. Chemically 18F is comparable in size to hydrogen. 18F has the best resolution of all positron emitters--approaching 2 mm. This is because most of the emitted positrons traveling only about 1.2 mm prior to undergoing an annihilation reaction. For a 10 mCi 18FDG injection, the effective patient dose is about 7 mSv [43,45].
The agent 18FDG competes with glucose for facilitated transport into myocardial cells and once inside the cell it competes for phosphorylation by hexokinase. Unlike glucose, however, the phosphorylated form is not further metabolized. Therefore, regional myocardial uptake of 18FDG reflects regional rates of exogenous glucose utilization. Only about 1 to 4% of the injected dose is trapped in the myocardium, but the target to background ratios are favorable (Heart:Lung [20:1], Heart:Blood [14:1]).
|
.Myocardial PET FDG imaging: |
|
|

18FDG uptake in the myocardium is highly dependent on the patient's dietary state [14]. In the fasting state (in the absence of carbohydrates and insulin) the myocardium uses free fatty acids for energy [129]. Myocardial glucose utilization is increased by glucose/carbohydrate administration (ie: such as following a meal) which stimulates insulin secretion. The increased insulin levels activate the predominantly expressed glucose transporter GLUT4 in normal myocardium allowing glucose to enter the cell and thereby increasing glucose metabolism, and tissue lipolysis is inhibited [15,129] (NOTE: in inflammatory cells, glucose enters the cell via GLUT1 and GLUT3 [129]). Therefore, in normal myocardium, 18FDG, uptake will be promoted in association with high glucose/insulin levels, but decreased in the face of high free-fatty acid levels (ie: with fasting). Unlike normal myocardium, regions of severely decreased perfusion (hibernating myocardium) preferentially utilize glucose as an energy substrate during periods of fasting in order to maintain cell viability. It is this difference in substrate utilization between normal and hibernating myocardium that forms the basis for PET myocardial viability imaging.
For metabolic imaging, patients fast for at least 6 hours and then receive a glucose load [27]. Several protocols are available to promote cardiac FDG uptake:
- Oral glucose
loading
- Hyperinsulinemic euglycemic clamping- this is the
preferred method as myocardial glucose uptake is maximized
and there is reduced heterogeneity of FDG accumulation in
viable myocardium [84].
- Administration of
nicotinic acid derivatives
Oral glucose loading: For non-diabetic patients with a fasting blood
glucose of less than 110 mg/dL
most 18FDG studies are performed
following a prolonged fast (over 6 hours) with glucose
loading- typically using an oral solution containing 50 to 100
gm of glucose given approximately 60 minutes before 18FDG administration [15,44,99].
Alternatively, a glucose infusion can be performed using a 10%
dextrose in water solution at a rate of 15 umole/kg/min. PET images are usually
acquired 45-60 minutes following injection of 18FDG.
Up to 90% of exams will be of adequate-to-excellent quality in
non-diabetic patients following glucose loading [15]. However,
other authors report poor image quality in 20-25% of patients
with coronary artery disease (particularly in diabetics) [22,25].
In patients with diabetes the increase in plasma insulin levels following glucose loading may be attenuated and the cells may be less able to respond to insulin stimulation [15,27]. Consequently, tissue lipolysis is not inhibited, plasma fatty acid levels remain high, and myocardial glucose uptake can be poor [15]. This can result in suboptimal quality exams. An improvement in image quality can be obtained by waiting 2-3 hours after tracer injection before imaging (at the expense of increased FDG decay) [27]. In diabetic patients following glucose loading, an IV bolus of regular insulin is given according to a sliding scale and the plasma glucose is checked every 15 minutes in order to maintain a stable serum glucose level of approximately 140 mg/dL.
FDG imaging in patients with non-insulin dependent diabetes is also problematic [20]. An oral glucose load and insulin boluses can be used to control blood glucose levels [20]. For a fasting plasma glucose level less than 7 mmol/L, a 25 g oral glucose solution is given; for 7-11 mmol/L , 5 IU of insulin is given I.V.; for a fasting glucose greater than 11 mmol/L, 10 IU of insulin is given I.V. [20]. The plasma glucose level is then measured in 15 minutes and insulin given according to a sliding scale: For 8 mmol/L no insulin is given; for 8-11 mmol/L, 5 IU of insulin is given I.V., and for a glucose level greater than 11 mmol/L, 10 IU of insulin is given I.V. [20].
Hyperinsulinemic-euglycemic clamping: Hyperinsulinemic-euglycemic clamping (HEC) requires the simultaneous infusion of glucose and insulin to achieve perfect metabolic regulation [22]. With the use of the clamp, high insulin levels, stable glucose levels, and low free fatty acid levels can be obtained [22]. The hyperinsulinemic-euglycemic clamp method has been shown to produce images with the highest myocardial to background ratio [20] even in diabetic patients, however, the method is time consuming and not practical for clinical work [15].
The procedure requires IV's placed in both the left and right arms- one is used for insulin infusion and the other for glucose. Insulin is infused at a rate of 100mU/kg/hr to achieve hyperinsulinemia [22]. A simultaneous glucose infusion (500mL of 20% glucose with 20mL of 14.9% potassium chloride to prevent hypokalemia) is infused at a rate ot 6 mg/kg/min and the rate is adjusted every 10 minutes to maintain normoglycemia [22]. After 60 minutes of clamping, the FDG is administered intravenously [22]. Potassium supplementation is required as insulin administration induces an intracellular migration of potassium and a subsequent decline in plasma concentration [84].
ASNC has proposed an abbreviated HEC protocol [84]. Non-diabetic patients receive priming doses of 5 units of insulin and 10 gm of dextrose IV [84]. This is followed by a dextrose-insulin infusion (15 units of insulin in 500 mL of 20% dextrose initially at 1.5 milliunits insulin/kg/min and 10 mg glucose/kg/min [84]. Diabetic patients receive priming doses of insulin (6-10 units), followed by separateinfusions of insulin (100 units in 500 mL of normal saline initially at 4 milliunits/kg/min) and glucose (20% dextrose initially at 6 mg glucose/kg/min) [84]. In both groups, blood samples shoould be drawn at 5-15 minute interval for measurement of blood glucose and serum potassium [84]. Euglycemia should be achieved in 20-30 minutes) [84]. To prevent HEC induced hypokalemia, potassium chloride (10 mEq) can be given IV if the patient's initial potassium level is less than 5 mmol/L and oral potassium supplementation of 40-80 mEq if initial plasma potassium is ≤ 4 and ≤ 3.5 mmol/L [84].
Nicotinic acid derivatives: Nicotinic acid derivatives have also been studied for use with PET FDG myocardial imaging [22]. The agent acipimox inhibits peripheral lipolysis and thereby reduces circulating free fatty acids [22]. Acipimox 250 mg is orally given 2 hours prior to FDG injection. Some centers will also give patients a carbohydrate and protein-enriched meal [22]. Image quality is generally very good (even in patients with diabetes [25]), with uninterpretable exams in about 5% of patients [22]. The effectiveness of this agent in patients with diabetes requires further study [22].
The typical dose used for the exam is 10-15 mCi infused over a 60 second interval.
Images are usually acquired 45-60 minutes following
administration of the radiotracer [30,99]. Non-gated
low-resolution CT is used for attenuation correction [99].
Previously, w performing attenuation correction with the use of
a transmission scan, ideally the transmission scan should be
performed prior to FDG injection. Post-injection transmission
scans may suffer from emission contamination and the resultant
attenuation corrected images can underestimation FDG activity by
about 20% unless an emission spillover adjustment is applied
[30].The radiation exposure is relatively low - about 6.6 mSv
for a 10 mCi dose of FDG [99].
PET FDG imaging
for the detection of viable myocardial tissue:
See also discussion for Viability imaging in the cardiac section
Hibernating myocardium represents severely ischemic, but viable myocardial tissue. In this condition there is a chronic reduction in myocardial metabolism and contractility in order to match a long-standing decrease in blood supply (chronic ischemia). In other words, the cells maintain viability, but energy production is insufficient to maintain mechanical work and contractile dysfunction results [1]. To accomplish this, areas of hibernating myocardium shift their energy source from aerobic to anaerobic glycolysis (i.e.: there is a shift from fatty acid to glucose metabolism) [62,66]. This may be a protective response by the myocytes to reduce their oxygen demand in the setting of reduced oxygen availability. This is a reversible phenomenon and ventricular contractile dysfunction can improve if flow is restored. Because enhanced left ventricular function after revascularization is associated with improved survival, it is crucial to identify areas of viable myocardial tissue.
Evaluation of glucose metabolism using 18FDG remains the gold standard for the evaluation of myocardial viability (hibernating myocardium) [1,6,19]. FDG imaging has been shown to be superior to thallium imaging for delineation of viable myocardial tissue (up to 30-50% of segments showing scar by delayed thallium demonstrate FDG uptake suggesting viability) [85]. Ischemic, but viable myocardium (hibernating) utilizes glucose in preference to other substrates. Ischemic myocardium will therefore concentrate an increased amount of 18FDG compared to normal myocardium. Increased utilization of glucose can also be seen in myocardium recovering from a recent ischemic event as enhanced anaerobic glycolytic activity persists for some time after reperfusion, despite the availability of adequate oxygen.
The viability examination is usually performed following some form of glucose loading even though this seems to be contradictory. It would seem most logical to perform 18FDG myocardial viability imaging in the fasting state when normal myocardial glucose utilization is very low (normal myocardium uses fatty acids for energy substrate in the fasting state). Unfortunately, fasting 18FDG imaging of the myocardium may be overly sensitive -- detecting small, clinically insignificant areas of myocardial viability because of low background myocardial activity. Additionally, the normal myocardium can be difficult to define in the fasting state and the tracer may not clear adequately from the blood, which can result in image degradation. The one drawback of glucose loading exams is that myocardial substrate utilization will shift from fatty acids to glucose and small areas of viable myocardium may be missed. In either case, the average positive predictive accuracy for detecting viable myocardium by fasting FDG studies is about 85% and is similar to post-glucose loading exams (81%).
Severely decreased FDG uptake below 50% of normal myocardial activity is generally considered indicative of scar, while uptake greater than 50% of normal myocardial activity is indicative of viability. However, determination of ischemic, but viable myocardium can only be made in relationship to a perfusion study [7]. The perfusion exam does not need to be performed with a PET agent; it can be performed using SPECT tracers such as thallium or technetium agents [18]. When regional myocardial 18FDG uptake is disproportionately enhanced when compared with regional myocardial blood flow, the pattern is termed a perfusion-metabolism mismatch. In the setting of chronic coronary artery disease, a perfusion-metabolic mismatch is highly predictive of myocardial viability and indicates a high likelihood of improved cardiac function following revascularization (improved contractility is seen in 80%-85% of cases and the average improvement in ejection fraction (EF) is 15%).
A scar is characterized by concordant reduction in perfusion
and FDG uptake (a FDG-perfusion match) [14]. Improved
wall motion is seen in only 8-17% of matched perfusion-metabolic
defects [14]. Based on the severity of the perfusion and FDG
deficit, the matched pattern may be categorized as a transmural match (absent or markedly
reduced perfusion and FDG uptake) or a non-transmural
match (mild to moderately reduced perfusion and FDG uptake).
When tracer activity equals 50 to 60% or more of peak activity,
the matches are mild and probably represent a non-transmural scar [14]. Contractile
reserve is more likely to be seen in regions of non-transmural MI [23]. If quantification is
performed, viable myocardium is very unlikely to exist if the
basal myocardial blood flow is less than 25 ml/min/100 gm [8].
|
Myocardial scar: The patient below was being considered for coronary bypass surgery. A rest thallium exam demonstrated findings consistent with an apical and anterior wall scar. FDG PET imaging was requested to confirm that the patient was not a surgical candidate. The PET scan demonstrated a severe apical and anterior wall metabolic defect with less than 50% of peak myocardial activity corresponding to the thallium scan abnormality. The finding was consistent with prior apical and anterior wall infarct. |
|
|


A "reverse mismatch" pattern has
been described in which there is decreased glucose utilization
relative to perfusion [94]. This pattern is most commonly seen
in the sub-acute phase (2-10 days) following reperfusion in an
acute MI (up to 48% of patients following PCI for acute
MI) [94]. Wall motion abnormalities are also common in
segments that demonstrate the reverse mismatch pattern [94].
Although the uptake of 18FDG can discriminate between viable and non-viable tissue, the regional myocardial blood flow and 18FDG uptake pattern is similar for varying types of myocardial dysfunction. Clinical symptoms are necessary to determine the exact etiology of the scan findings. For instance, increased utilization of glucose can also be seen in myocardium recovering from a recent ischemic event as enhanced anaerobic glycolytic activity persists for some time after reperfusion, despite the availability of adequate oxygen. Different conditions may also coexist in the same myocardial regions.
Condition
|
rMBF
|
FDG Uptake
|
Clinical State
|
|
Acute ischemia |
Decreased |
Normal or increased |
Chest pain/Angina |
|
Hibernating |
Decreased |
Normal or increased |
Chronic stable |
|
Stunning |
Normal |
Normal or increased |
Following acute event |
|
Necrosis/Scar |
Decreased |
Decreased |
Chronic symptoms |
Prognostic
Implications of FDG PET Myocardial Imaging (General):
Cardiac events and mortality:
PET studies have shown that cardiac morbidity and mortality is increased in patients with flow-metabolic mismatches [18,57]. Up to 50% of patients that demonstrate a perfusion-metabolic mismatch will have a cardiac event in the subsequent 12 months in the absence of intervention. The greater the number of mis-matched segments identified, the greater the risk for subsequent cardiac event if revascularization is not performed [18]. The incidence of cardiac events drops to 15% in these patients if revascularization is performed [9]. In two other studies, mortality ranged between 4 to 12% in the group with matched defects, and between 33 and 41% in the mismatch group. In the mismatch group, if revascularization was performed, mortality dropped to between 4 and 12% [7]. In a meta-analysis of patients with viable myocardium, revascularization was found to be associated with an approximately 80% reduction in annual mortality [44].
In patients with underlying left ventricular dysfunction:
It is well recognized that in patients with coronary artery disease (CAD) on medical therapy, the presence of left ventircular (LV) dysfunction is associated with a high mortality. In the Coronary Artery Surgery Study (CASS), mortality of medically treated patients was related to the severity of LV dysfunction with up to 25% annual mortality in patients with resting LVEF's below 25%. In patients with LVEF's below 35% survival was better in those patients undergoing revascularization. Unfortunately, revascularization cannot be recommended in all patients with poor LV function because the surgery is associated with a 5 to 35% mortality in this subgroup. Ideally, the surgery should be performed only in those patients with a high likelihood of improved LV function.
In patients with symptoms of cardiac failure a PET pattern of perfusion-metabolic mismatch identifies a subgroup of patients who are at very high risk for cardiac death on medical therapy (30-40%). These patients are most likely to show significant clinical improvement and have prolonged survival as a result of revascularization [1,18]. Hence, PET can be used to select the appropriate cohort of patients most likely to benefit from surgery and avoid the cost and risks of this procedure if the patient will have no benefit (resulting in an overall cost reduction) [47]. PET results can alter clinical decision making regarding revascularization in approximately 60% of patients [47].
For the prediction of improvement in regional LV function after revascularization, 18FDG -PET imaging has a pooled sensitivity of 88-93%, a specificity of 58-73%, a positive predictive value of 76%, a negative predictive value of 86%-88% [14, 19, 21,57], and an accuracy of 74%-95% [16]. A matched perfusion-metabolism defect is 75%-100% accurate in predicting that segmental wall motion will not improve [16]. Improved wall motion is seen in only 8%-17% of matched perfusion-metabolic defects [14]. Unfortunately, not all patients with evidence of viable myocardium on PET imaging demonstrate improvement in wall motion following revascularization [24]. Despite a substantial amount of viable myocardium these patients may have non-transmural infarcts with endocardial necrosis (the endocardium contributes almost 75% to total wall thickening at rest) [24] or severe ultrastructure damage which limits contractile reserve [34].
For overall left ventricular function, as a general rule, the larger the extent of the perfusion-metabolic mismatch, the greater will be the anticipated improvement in LVEF following revascularization [34]. If 17% [37] to 25% or more of the LV is viable, a significant improvement in LVEF can be expected following revascularization [14]. Patients with large mismatches (more than 18% of the myocardium [44]) also achieve significantly higher functional status compared to patients with minimal or no PET mismatch [34,44]. On average, LVEF has been shown to improve about 10 percentage points in patients with viable myocardium [57].
The perfusion-metabolism mismatch pattern is also predictive of improvement in heart failure symptoms after revascularization [10]. In patients with heart failure symptoms and a PET perfusion-metabolic mismatch, 70% had improvement in symptoms following revascularization, while only 30% without a mismatch experienced improvement. Improvement in heart failure symptoms correlates with the preoperative extent of viable myocardium [37]. Patients with a PET mismatch pattern involving 18% or more of the LV volume appear to show the greatest clinical benefit [37]. In patients with ischemic cardiomyopathies being considered for revascularization, LVEF and LV volume information determined from gated FDG PET provide incremental prognostic value [35]. Patients with LVEF's below 25% or EDV's greater than 260 mL may not demonstrate improvement in heart failure symptoms following revascularization (although they may still derive a survival benefit) [35]. This is most likely related to advanced ventricular remodeling [35].
|
Perfusion-Metabolism Mismatch: The case below is from a 62-year-old female patient 8-years status post CABG and 6 months following an anterior wall myocardial infarction. The patient presented with symptoms of congestive heart failure and a LV ejection fraction of 22%. Perfusion exam was performed using NH3. There is an extensive, severe perfusion defect involving the apex, anterior, and septal walls. Metabolic images performed using FDG demonstrate disproportionately enhanced uptake when compared to the perfusion study. This is referred to as a perfusion-metabolism mismatch which is considered reflective of hibernating myocardium. At angiography the patient was found to have an occluded bypass graft and a second bypass was performed. Six months later the patient was asymptomatic and the LV ejection fraction had increased to 47%. Case courtesy of CTI, Inc. |
|
|

In the Immediate Post Infarct Period:
In patients with acute MI, FDG PET may be unreliable for the
assessment of myocardial viability because reduced glucose
uptake has been observed in reperfused, viable non-necrotic
myocardium resulting in overestimation of the area of infarction
(preserved flow, but reduced metabolic activity or a "reverse
mismatch") [118]. This reperfused myocardium has been reported
to show a strong preference for oxidative fatty acid metabolism
[118].
However, other authors suggest that in the immediate post infarction period (out to 1-week post event) the functional outcome of infarcted segments with a flow-metabolism mismatch pattern is more variable and does not necessarily imply recovery of contractile function following revascularization (ie: in the post infarct period PET may overestimate the potential for recovery) [8].
Limitations of PET metabolic imaging:
Limitations of FDG imaging include limited data in diabetic patients and recent reports that suggest that increased FDG accumulation can be seen in acute evolving myocardial infarctions [1, 11]. In the immediate post infarction period (out to 1-week post event) the functional outcome of infarcted segments with a flow-metabolism mismatch pattern is more variable and does not necessarily imply recovery of contractile function following revascularization (for example, in the post infarct period PET may overestimate the potential for recovery) [8]. Also, in the evaluation of FDG-PET for myocardial viability there is wide variability in the literature regarding patient inclusion criteria and examination protocol [14].
Other
Approaches to Metabolic Myocardial Imaging
In addition to standard perfusion-metabolic imaging using 18FDG, other approaches have also been utilized to assess for viability, including determination of oxidative metabolism with 11C palmitate, uptake and retention of 82Rb, 18F fluoroisonidazole imaging, and the water-perfusable tissue index.
PET Metabolic Myocardial Fatty Acid Imaging
Fatty acids are the major source of energy for the myocardium- long chain fatty acids account for 90% of the myocardial energy requirements in the fasting state.. Fatty acid oxidation generates about 6 times the ATP of glycogen oxidation [59]. When glucose or insulin levels are high, such as after a meal, glucose oxidation increases and fatty acid use is suppressed [2]. During ischemia, glucose again plays a major role in oxidative metabolism, whereas oxidation of long chain fatty acids is greatly reduced [2]. Free fatty acids are transported in the blood bound to albumin [59]. Catecholamines increase the blood concentration of fatty acids [16]. Myocardial uptake and retention of fatty acids has been shown to be affected by ischemia [59]. During ischemia, fatty acid metabolism is affected in a matter of seconds [58].
C-11 palmitate
Carbon-11 is a cyclotron produced positron emitter with a half-life of 20.4 minutes and a positron range of 0.4 mm [44]. 11C can be labeled to long-chain fatty acids to study myocardial metabolism [44].
Long-chain free fatty acids easily pass through the sarcolemmic membrane to be activated as acylcoenzyme A (CoA). Acyl CoA is carried into mitochondria through an acyl carnitine carrier system to enter the beta-oxidation pathway. After beta-oxydation , acetyl CoA is formed and enters into the tricarbonic acid cycle for further oxidation to become water and carbon dioxide. Palmitic acid comprises approximately 25 to 30% of the circulating fatty acid in the blood and serves as one of the primary sources for energy production by the heart. The distribution of C-11 labeled palmitic acid reflects efficiency of myocardial energy production.
After initial uptake of the tracer, there is a rapid clearance component which corresponds to levels of beta-oxidation. This is followed by a slower clearance component which reflects incorporation of the tracer into triacylglycerols and phospholipids.
In normal myocardium, there is homogeneous distribution of the tracer. The half-time of washout after extraction is about 12-18 minutes in the normal heart- reflecting the pathway of tracer uptake, beta-oxidation, and efflux of the end product (CO2) [58]. During periods of ischemia, the uptake of the agent and the rate of the rapid clearance phase and its magnitude markedly diminish, consistent with diminished oxidative metabolism. Delayed clearance is also observed from ischemic and infarcted regions as a result of decreased fatty acid oxidation. C-11 palmitate exams reveal segmental reductions of blood flow in acutely ischemic myocardium are associated with delayed clearance of 11C-palmitate and an increase in 18-FDG uptake.
The rapid blood clearance of this agent and loss of radioactivity from myocardial tissue due to straight-chain fatty-acid catabolism by beta oxidation complicate data analysis. A drawback of this agent is that it is affected by plasma substrate concentrations--in the fasting state, when glucose levels are low, fatty-acid metabolism is accelerated and C-11 palmitate washout is rapid. Washout decreases markedly with glucose loading. The critical organ is the liver.
1-[11C] acetate
Another agent, 1-[11C] acetate can also be used to assess overall oxidative metabolism and the tricarboxylic acid cycle. The tracer is well extracted by the myocardium and is then converted to acetyl-CoA. Acetyl-CoA is the entry point for all metabolic pathways into the tricarboxylic acid cycle within the mitochondria. Oxidation of acetyl-CoA leads to the production of C-11 labeled CO2 reflecting the activity of the tricarboxylic acid cycle that, under normal conditions, reflects overall oxidative metabolism (i.e: the efflux of labeled CO2 after the administration of C-11 acetate reflects myocardial oxygen consumption [58]).
Even in the face of changing patterns of myocardial substrate use, the clearance of 1-[11C] acetate accurately delineated overall oxidative metabolism (ie: unlike C-11 palmitate, this agent is not affected by plasma substrate concentrations). The maintenance of oxidative metabolism in jeopardized myocardium was identified as a prerequisite to recovery of function following revascularization. Myocardial uptake and clearance are homogeneous in normal subjects. In infarcted myocardium, there is decreased uptake and clearance of the tracer due to the reduced oxygen consumption.
The predictive accuracy of this tracer in viability assessment may be superior to FDG. In one study, 15% of nonviable myocardial regions demonstrated increased uptake of FDG relative to flow, but diminished levels of oxidative metabolism, while 20% of viable segments (demonstrating normal oxidative metabolism) had reduced FDG accumulation [11].
Rubidium-82
For Rb-82 imaging in the evaluation of myocardial viability
there is unfortunately no association between the severity of a
fixed defect on 82Rb imaging and the likelihood of
myocardial viability in that area. In defects containing less
than 50% relative activity, 30% were shown to be viable by FDG
imaging [13].
Other agents:
18F-Fluoromisonidazole
18F-Fluoromisonidazole has been shown to have increased retention in hypoxic, non-infarcted myocardium. It can therefore be useful for the selective delineation of hypoxic, but viable tissue.
H2150 Water
(H215O) can be used to determine the
water-perfusable tissue index.
Contractile function is thought to improve after
revascularization only if the perfusible
tissue fraction is at least 70%.
11C-meta-hydroxyephedrine (11C-HED)
11C-meta-hydroxyephedrine (11C-HED) can
be used to characterize cardiac innervation [120]. 11C-HED
is taken up by cardiac presynaptic neurons but not metabolized
by synaptic degradation enzymes [120]. Similar to MIBG,
decreased 11C-HED retention in patients with heart
failure has been associated with increased cardiac mortality and
the need for cardiac trasnplantation [120].
It has been shown that following myocardial infarction, the
area of reduced innervation often exceeds the area of reduced
myocardial blood flow [121]. The occurrence of such
flow-innervation mismatch zones is related to inducible
ventricular tachycardias originating from these zones [121,125].
These zones appear to correspond to "grey zone" tissue on late
phase contrast MR imaging which is hypothesized to constitute
islands of viable myocardial tissue in the infarct zone [126].
As infarcted tissue is imaged to produce high signal (white
areas) against black myocardium, the grey tissue is felt to
represent an average of pixel values that result in intermediate
signal in the penumbra zone (although partial volume effects may
also play a role) [126].
REFERENCES:
(1) Radiographics
1999; Jadvar H, et al. SPECT and PET in the evaluation of coronary
artery disease. 19: 915-926
(2) J Nucl Med 2000; Tamaki N, et al. The role of fatty acids in cardiac imaging. 41: 1525-1534
(3) J Nucl Med 1994; Schwaiger M. Myocardial perfusion imaging with PET. 35: 693-98
(4) J Nucl Med 1995; de Jong RM, et al. Posterolateral defect of the normal human heart investigated with nitrogen-13-ammonia and dynamic PET. 36: 581-585
(5) J Nucl Med 1998; Wallhaus TR, et al. Human biodistribution and dosimetry of the PET perfusion agent Copper-62-PTSM. 39: 1958-1964
(6) J Nucl Med 1995; Delbeke D, et al. Rest myocardial perfusion/metabolism imaging using simultaneous dual-isotope acquisition SPECT with technetium-99m-MIBI/fluorine-18-FDG. 36: 2110-19
(7) J Nucl Med 1994; Schelbert HR. Metabolic imaging to assess myocardial viability. 35(4 Suppl):8S-14S. Review
(8) J Nucl Med 1995; Grandin C, et al. Delineation of myocardial viability with PET. 36(9):1543-52
(9) J Am Coll Cardiol 1992; Eitzman D, et al. Clinical outcome of patients with advanced coronary artery disease after viability studies with positron emission tomography. 20: 559-65
(10) J Nucl Med 1994; Maddahi J. Cardiovascular nuclear medicine: state-of-the-art. 35(4):672-3 (No abstract available)
(11) J Nucl Med 1994; Bergmann SR. Use and limitations of metabolic tracers labeled with positron-emitting radionuclides in the identification of viable myocardium. 35(4 Suppl):15S-22S. Review
(13) Radiology 1995; Go RT, et al. Hibernating myocardium versus scar: severity of irreversible decreased myocardial perfusion in prediction of tissue viability. 194:151-55
(14) Semin Nucl Med 2000; Bax JJ, et al. 18-Fluorodeoxyglucose imaging with positron emission tomography and single photon emission computed tomography: Cardiac applications. 30: 281-298
(15) J Nucl Cardiol 2001; Dilsizian V, et al. Fluorine-18-deoxyglucose SPECT and coincidence imaging for myocardial viability: Clinical and technical issues. 8: 75-88 (No abstract available)
(16) J Nucl Med 1993; Schelbert H, et al. Positron statement: Clinical use of cardiac positron emission tomography. Position paper of the cardiovascular council of the society of nuclear medicine. 34: 1385-88 (No abstract available)
(17) J Nucl Med 1993; Garcia EV, et al. What should we expect from cardiac PET? 34: 978-980 (No abstract available)
(18) J Nucl Med 2001; Zhang X, et al. Clinical outcome of patients with previous myocardial infarction and left ventricular dysfunction assessed with myocardial 99mTc-MIBI SPECT and 18F-FDG PET. 42: 1166-1173
(19) J Nucl Med 1998; Bax JJ, et al. Comparison of fluorine-18-FDG with rest-redistribution thallium-201 SPECT to delineate viable myocardium and predict functional recovery after revascularization. 39: 1481-1486 (No abstract available)
(20) J Nucl Med 2001; Vitale GD, et al. Myocardial glucose utilization and optimization of 18F-FDG imaging in patients with non-insulin-dependent diabetes mellitus, coronary artery disease, and left ventricular dysfunction. 42: 1730-1736
(21) J Am Coll Cardiol 1997 Bax JJ, et al. Accuracy of currently available techniques for prediction of functional recovery after revascularization in patients with left ventricular dysfunction due to chronic coronary artery disease: Pooled comparison data. 30: 1451-60
(22) J Nucl Cardiol 2002; Bax JJ, et al. Safety and feasibility of cardiac FDG SPECT following oral administration of Acipimox, a nicotinic acid derivative: comparison of image quality with hyperinsulinemic euglycemic clamping in nondiabetic patients. 9: 587-593
(23) J Nucl Med 2003; Schinkel AFL, et al. Dobutamine-induced contractile reserve in stunned, hibernating, and scarred myocardium in patients with ischemic cardiomyopathy. 44: 127-133
(24) J Nucl Cardiol 2003; Kaul S. What lies beyond a chronically occluded coronary artery, and what should we do about it. 10: 92-94 (No abstract available)
(25) J Nucl Med 2003; Schinkel AFL, et al. Effect of diabetes mellitus on myocardial 18F-FDG SPECT using acipimox for the assessment of myocardial viability. 44: 877-883
(26) J Nucl Med 2003; Knesaurek K, et al. Comparison of 2-dimensional and 3-dimensional 82Rb myocardial perfusion PET imaging. 44: 1350-1356
(27) J Nucl Cardiol 2003; Bacharach SL, et al. PET myocardial glucose metabolism and perfusion imaging: part I- guidelines for patient preparation and data acquisition. 10: 545-556 (No abstract available)
(28) J Nucl Cardiol 2003; Schelbert HR, et al. PET myocardial perfusion and glucose metabolism imaging: part 2- guidelines for interpretation and reporting. 10: 557-571 (No abstract available)
(29) J Nucl Cardiol 2004; Beller GA, Bergmann SR. Myocardial perfusion imaging agents: SPECT and PET. 11: 71-86 (No abstract available)
(30) J Nucl Med 2004; van der Weerdt AP, et al. Postinjection transmission scanning in myocardial 18F-FDG studies using both filtered backprojection and iterative reconstruction. 45: 169-175
(31) J Nucl Med 2004; Koepfli P, et al. CT attenuation correction for myocardial perfusion quantification using a PET/CT hybrid scanner. 45: 537-542
(32) J Nucl Med 2004; Loghin C, et al. Common artifacts in PET myocardial perfusion images due to attenuation-emission mis-registration: clinical significance, causes, and solutions. 45: 1029-1039
(33) J Nucl Cardiol 2004; Rimoldi OE, et al. Positron emission tomography for quantification of myocardial perfusion. 11: 482-489
(34) J Nucl Cardiol 2004; Maddahi J. Factors influencing predictive value of FDG imaging for evaluating myocardial viability. 11: 526-526
(35) J Nucl Cardiol 2004; Santana CA, et al. Incremental prognostic value of left ventricular function by myocardial ECG-gated FDG PET imaging in patients with ischemic cardiomyopathy. 11: 542-550
(36) J Nucl Med 2004; Marshall RC, et al. Kinetic analysis of 18F-fluorodihydrorotenone as a deposited myocardial blood flow tracer: comparison to 201Tl. 45: 1950-1959
(37) J Nucl Cardiol 2004; Di Carli MF. Advances in positron emission tomography. 11: 719-732
(38) J Nucl Med 2005; DiFilippo FP, Brunken RC. Do implanted pacemaker leads and ICD leads cause metal-related artifact in cardiac PET/CT? 46: 436-443
(39) J Nucl Med 2005; Namdar M, et al. Integrated PET/CT for the assessment of coronary artery disease: a feasibility study. 46: 930-935
(40) J Nucl Cardiol 2005; Hickey KT, et al. An improved model for the measurement of myocardial perfusion in human beings using N-13 ammonia. 12: 311-317
(41) J Nucl Cardiol 2005; Herrero P, Gropler RJ. Imaging of myocardial metabolism. 12: 345-358
(42) J Nucl Med 2005; Chow BJW, et al. Prognostic significance of dipyridamole-induced ST depression in patients with normal 82Rb PET myocardial perfusion imaging. 46: 1095-1101
(43) J Nucl Med 2005; Stankewicz MA, et al. Myocardial viability assessment by PET: 82Rb defect washout does not predict the results of metabolic-perfusion mismatch. 46: 1602-1609
(44) Radiol Clin N Am 2005; Takalkar A, et al. PET in cardiology. 43: 107-119
(45) J Nucl Cardiol 2006; Thompson RC, Cullom SJ. Issues regarding radiation dosage of cardiac nuclear and radiography procedures. 13: 19-23
(46) J Nucl Cardiol 2006; Bateman TM, et al. Diagnostic accuracy of rest/stress ECG-gated Rb-82 myocardial perfusion PET: comparison with ECG-gated Tc-99m sestamibi SPECT. 13: 24-33
(47) J Nucl Cardiol 2006; Bengel FM. Positron emission tomography and magnetic resonance imaging in heart failure. 13: 145-149
(48) J Nucl Cardiol 2006; Le Meunier L, et al. PET/CT imaging: effect of respiratory motion on apparent myocardial uptake. 13: 821-830
(49) J Nucl Med 2007; Martinez-M?ller A, et al. Artifacts from misaligned CT in cardiac perfusion PET/CT studies: frequency, effects, and potential solutions. 48: 188-193
(50) J Nucl Med 2007; Dorbala S, et al. Value of vasodilator left ventricular ejection fraction reserve in evaluating the magnitude of myocardium at risk and the extent of angiographic coronary artery disease: a 82Rb PET/CT study. 48: 449-358
(51) J Nucl Med 2007; Bacharach SL. PET/CT attenuation correction: breathing lessons. 48: 677-679
(52) J Nucl Med 2007; Di Carli MF, et al. Clinical myocardial perfusion PET/CT. 48: 783-793
(53) J Nucl Med 2007; Alessio AM, et al. Cine CT for attenuation correction in cardiac PET/CT. 48: 794-801
(54) J Nucl Med 2007; Cook RAH, et al. Respiration-averaged CT for attenuation correction in canine cardiac PET/CT. 48: 811-818
(55) J Nucl Med 2007; Merhige ME, et al. Impact of myocardial perfusion imaging with PET and 82Rb on downstream invasive procedure utilization, costs, and outcomes in coronary disease management. 48: 1069-1076
(56) J Nucl Med 2007; Gould KL, et al. Frequent diagnostic errors in cardiac PET/CT due to misregistration of CT attenuation and emission PET images: a definitive analysis of causes, consequences, and corrections. 48: 1112-1121
(57) J Nucl Med 2007; Schinkel AFL, et al. Assessment of myocardial viability in patients with heart failure. 48: 1135-1146
(58) J Nucl Cardiol 2007; Bergmann SR. Imaging of myocardial fatty acid metabolism with PET. 14: S118-24
(59) J Nucl Cardiol 2007; Eckelman WC, Babich JW. Synthesis and validation of fatty acid analogs radiolabeled by nonisotopic substitution. 14: S100-109
(60) J Nucl Cardiol 2007; Di Carli MF, et al. Relationship between CT coronary angiography and stress perfusion imaging in patients with suspected ischemic heart disease assessed by integrated PET-CT imaging. 14: 799-809
(61) J Nucl Cardiol 2008; Di Carli MF, Hachamovitch R. Hybrid PET/CT is greater than the sum of its parts. 15: 118-122
(62) J Nucl Med 2008; Vesely MR, Dilsizian V. Nuclear cardiac stress testing in the era of molecular medicine. 49: 399-413
(63) J Nucl Med 2008; Gould KL, et al. Reducing radiation dose in rest-stress cardiac PET/CT by single poststress cine CT for attenuation correction: quantitative validation. 49: 738-745
(64) J Nucl Cardiol 2008; Neglia D, Parodi O. Detecting the impact of emerging cardiovascular risk factors: the role of positron emission tomography. 15: 485-490
(65) J Nucl Med 2008; Chander A, et al. Comparison of measures of left ventricular function from electrocardiographically gated 82Rb PET with contrast-enhanced CT ventriculography: a hybrid PET/CT analysis. 49: 1643-1650
(66) J Nucl Med 2008; Dilsizian V. 18F-FDG uptake as a surrogate marker for antecedent ischemia. 49: 1909-1911
(67) J Nucl Med 2008; Dou KF, et al. Myocardial 18F-FDG uptake after exercise-induced myocardial ischemia in patients with coronary artery disease. 49: 1986-1991
(68) J Nucl Med 2008; Slomka PJ, et al. Comparison of myocardial perfusion 82Rb PET performed with CT- and transmission CT-based attenuation correction. 49: 1992-1998
(69) J Nucl Cardiol 2008; Lertsburapa K, et al. Independent and incremental prognostic value of left ventricular ejection fraction determined by stress gated rubidium 82 PET imaging in patients with known or suspected coronary artery disease. 15: 745-753
(70) J Nucl Med 2009; Tio RA, et al. Comparison between the prognostic value of left ventricular function and myocardial perfusion reserve in patients with ischemic heart disease. 50: 214-219
(71) J Nucl Cardiol 2009; Beller GA. Can we enhance the detection of ischemia and better identify high risk coronary artery disease by imaging of myocardial metabolism? 16: 1-3
(72) J Nucl Med 2009; El Fakhri G, et al. Reproducibility and accuracy of quantitative myocardial blood flow assessment with 82Rb PET: comparison with 13N-ammonia PET. 50: 1062-1071
(73) J Nucl Med 2009; Camici PG, Rimoldi OE. The clinical value of myocardial blood flow measurement. 50: 1076-1087
(74) J Nucl Med 2009; Shaw LJ, Narula J. Risk assessment and predictive value of coronary artery disease testing. 50: 1296-1306
(75) J Nucl Cardiol 2009; Knuuti J, et al. Quantification of myocardial blood flow will reform the detection of CAD. 16: 497-506
(76) J Nucl Cardiol 2009; Beller GA. Will cardiac positron emission tomography ultimately replace SPECT for myocardial perfusion imaging? 16: 841-843
(77) J Nucl Cardiol 2009; Heller GV, et al. Recent advances in cardiac PET and PET/CT myocardial perfusion imaging. 16: 962-969
(78) J Nucl Med 2010; Javadi MS, et al. Definition of vascular territories on myocardial perfusion images by integration with true coronary artery anatomy: a hybrid PET/CT analysis. 51: 198-203
(79) J Nucl Cardiol 2010; Esteves FP, et al. Prompt-gamma compensation in Rb-82 myocardial perfusion 3D PET/CT. 17: 247-253
(80) J Nucl Cardiol 2010; Al-Mallah MH, et al. Assessment of myocardial perfusion and function with PET and PET/CT. 17: 498-513
(81) J Nucl Cardiol 2010; Klein R, et al. Quantification of myocardial blood flow and reserve: technical aspects. 17: 555-570
(82) J Nucl Cardiol 2010; Ziadi MC, et al. The clinical utility of assessing myocardial blood flow using positron emission tomography. 17: 571-581
(83) J Nucl Cardiol 2010; Klein R, et al. Intra- and Inter-operator repeatability of myocardial blood flow and myocardial flow reserve measurements using rubidium-82 pet and a highly automated analysis program. 17: 600-16
(84) J Nucl Cardiol 2010; Fallavollita JA, et al. An abbreviated hyperinsulinemic-euglycemic clamp results in similar myocardial glucose utilization in both diabetics and non-diabetic patients with ischemic cardiomyopathy. 17: 637-645
(85) J Nucl Cardiol 2010; Beanlands RSB, Youssef G. Diagnosis and prognosis of coronary artery disease: PET is superior to SPECT: Pro. 17: 683-695
(86) J Nucl Med 2010; Wells RG< et al. Single-phase CT aligned to gated PET for respiratory motion correction in cardiac PET/CT/ 51: 1182-1190
(87) J Nucl Med 2010; Senthamizhchelvan S, et al. Human biodistribution and radiation dosimetry of 82Rb. 51: 1592-1599
(88) J Nucl Med 2011; Senthamizhchelvan S, et al. Radiation dosimetry of 82Rb in
humans under pharmacologic stress. 52: 485-491
(89) J Nucl
Cardiol 2011; Johnson NP, et al.
Partial volume correction incorporating Rb-82 positron range
for quantitative myocardial perfusion PET based on
systolic-diastolic activity ratios and phantom measurements.
18: 247-258
(90) J Nucl Med 2011; Fukushima K,
et al. Prediction of short-term cardiovascular events using
quantification of global myocardial flow reserve in patients
referred for clinical 82Rb PET perfusion imaging. 52: 726-732
(91) J Nucl Cardiol 2011; deKamp
RA, et al. Incremental prognostic value of coronary flow
reserve assessed with single-photon emission computed
tomography. 18: 541-543
(92) J Nucl Cardiol 2011;
Henzlova MJ, Duvall WL. The future of SPECT MPI: time and dose
reduction. 18: 580-587
(93) J Nucl Cardiol 2011; Vermeltfoort IA, et al. Feasibility
of subendocardial and subepicardial myocardial perfusion
measurements in healthy normals with 15O-labeled
water and positron emission tomography. 18: 650-666
(94) J Nucl Cardiol 2011; Anselm DD, et al. Altered myocardial
glucose utilization and the mismatch pattern on rubidium-82
perfusion/F-18 FDG PET during the sub-acute phase following
reperfusion of acute anterior myocardial infarction. 18: 657-667
(95) Radiographics 2011; DiCarli MF, Murthy VL. Cardiac PET/CT
for the evaluation of known or suspected coronary artery
disease. 31: 1239-1254
(96) J Nucl Med 2011; Di Carli MF, et al. Coronary circulation
function in patients with the metabolic syndrome. 52: 1369-1377
(97) J Nucl Cardiol 2012; Bateman TM. Advantages and
disadvantages of PET and SPECT in a busy clinical practice. 19:
S3-11
(98) J Nucl Cardiol 2012; Maddahi J. Properties of anm ideal
PET perfusion tracer: new PET tracer cases and data. 19: S30-37
(99) J Nucl Cardiol 2012; DePuey EG, et al. Patient-centered
imaging. 19: 185-215
(100) J Nucl Cardiol 2012; Gewirtz H. PET measurement of
adenosine stimulated absolute myocardial blood flow for
physiological assessment of the coronary circulation. 19:
347-354
(101) J Nucl Med 2012; Rischpler C, et al. Transient ischemic
dilatation ratio in 82Rb PET myocardial perfusion imaging:
normal values and significance as a diagnostic and prognostic
marker. 53: 723-730
(102) J Nucl Med 2012; Fukishima K,
et al. Impaired global myocardial flow dynamics despite normal
left ventircular function and regional perfusion in chronic
kidney disease: a quantitative analysis of clinical 82Rb PET/CT studies.
53: 887-893
(103) J Nucl Cardiol 2012; Knuuti
J, Saraste A. Advances in clinical application of quantitative
myocardial perfusion imaging. 19: 643-646
(104) J Nucl Cardiol 2012; Ziadi
MC, et al. Does quantification of myocardial flow reserve
using rubdium-82 positron emission tomography facilitate
detection of multivessel coronary artery disease. 19: 670-680
(105) J Nucl Cardiol 2012; Beller
GA. Quantification of myocardial bloof flow with PET: ready
for clinical application. 19: 877-878
(106) J Nucl Cardiol 2012;
Al Jaroudi W, et al. Predictors and incremental prognostic value
of left ventricular mechanical dyssynchrony response during
stress-gated positron emission tomography in patients with
ischemic cardiomyopathy. 19: 958-969
(107) J Nucl Cardiol 2012; Shaw LJ, et al. Prognosis in the era
of comparative effectiveness research: where is nuclear
cardiology now and where should it be? 19: 1026-1043
(108) J Nucl Cardiol 2012; Saraste A, et al. PET: is myocardial
flow quantification a clinical reality. 19: 1044-1059
(109) J Nucl Cardiol 2012; Slomka PJ, et al. Low dose 3D 82Rb PET PET. 19: 1110-1112
(110) J Nucl Med 2013; Rajaram M,
et al. Cardiac PET/CT misregistration causes significant
changes in estimated myocardial blood flow. 54: 50-54
(111) J Nucl Cardiol 2013;
Cullom SJ, et al. Regadenoson pharmacologic rubidium-82 PET: a
comparison of quantitative perfusion and function to
dipyridamole. 20: 76-83
(112) J Nucl Med 2013; Hsiao E, et al. Detection of obstructive
coronary artery disease using regadenoson stress and 82Rb PET/CT
myocardial perfusion imaging. 54: 1748-1754
(113) J Nucl Cardiol 2013; Van Tosh
A, et al The relationship between ischemia-induced left
ventricular dysfunction, coronary flow reserve, and coronary
steal on regadenson stress-gated 82Rb PET myocardial
pefusion imaging. 20: 1060-1080
(114) J Nucl Cardiol 2013; McMahon
SR, et al. Feasibility of stress only rubidium-82 PET
myocardial perfusion imaging. 20: 1069-1075
(115) J Nucl Med 2014; Renaud JM,
et al. Clinical interpretation standards and quality assurance
for the multicenter PET/CT trial rubidium-ARMI. 55: 58-64
(116) J Nucl Cardiol 2015; Ahmed
FZ, et al. Metal artifact reduction algorithms prevent false
positive rsults when assessing patients for cardiac
implantable electronic device infection. 22: 219-220
(117) J Nucl Cardiol 2015;
Beanlands R, Heller GV. Proceedings of the ASNC cardiac PET
summit, 12 May 2014, Baltimore, MD. 1: The value of PEY:
integrating cardiovascular PET into the care continuum. 22:
557-562
(118) Radiology 2015; Nensa F, et
al. Integrated FDG PET/MR imaging for the assessment of
myocardial salvage in reperfused acute myocardial infarction.
276: 400-407
(119) J
Nucl Cardiol 2015; Blankstein R, et al. Proceedings of the
ASNC cardiac PET summit meeting, May 12, 2014, Baltimore MD.
5. Advances in radiopharmaceutical availability and
development of cardiac PET tracers. 22: 720-729
(120) J Nucl Med 2015; Dilsizian V,
Eckelman WC. Myocardial blod flow and innervation measures
from a single scan: an appealing concept but a challenging
paradigm. 56: 1645-1646
(121) J Nucl Med 2015; Harms HJ, et al. Use
of a single 11C-meta-hydroxyephedrine scan for
assessing flow-innervation mismatches in patients with
ischemic cardiomyopathy. 56: 1706-1711
(122) J Nucl Cardiol 2015; Slomka PJ, et
al. Automatic registration of misaligned CT attenuation
corrections maps in Rb-82 PET/CT improves detection of
angiographically significant coronary artery disease. 22:
1285-1295
(123) J Nucl Cardiol 2016; Bajaj NS, et al. The prognostic value of non-perfusion variables obtained during vasodilator stress myocardial perfusion imaging. 23: 390-413
(124) J Nucl Cardiol 2016; Schindler TH. Myocardial blood flow:
putting it into clinical perspective. 23: 1056-1071
(125) J Nucl Cardiol 2016; de Haan S, et al Myocardial
denervation coincides with scar heterogeneity on ischemic
cardiomyopathy: a PET and CMR study. 23: 1480-1488
(126) J Nucl Cardiol 2016; Christian TF. A rose by any other
name. 23: 1489-1492
(127) J Nucl Cardiol 2017; Van Tosh A, et al. Relationships
between left ventricular asynchrony and myoacrdial blood flow.
24: 43-52
(128) J Nucl Cardiol 2017; Malhotra S, Canty JM. Vasodilator
stress and left ventricular function. 24: 53-56
(129) J Nucl Cardiol 2017; Osborne MT, et al. Patient
preparation for cardiac fluorine-18 fluorodeoxyglucose positron
emission tomography imaging of inflammation. 24: 86-99
(130) J Nucl Cardiol 2017; Sevag RR, Maddahi J.
Regadenoson-induced hyperemia for absolute myocardial blood flow
quantitation by 13N-ammonia PET and detections of allograft
vasculopathy. 24: 1145-1148
(131) J Nucl Cardiol 2017; Case JA, et al. Status of
cardiovascular PET radiation exposure and strategies for
reduction: an information statement from the cardiovascular PET
task force. 24: 1427-1439
(132) J Nucl Cardiol 2017; Maddahi J, Packard RRS. PET should
replace SPECT in cardiac imaging for diagnosis and risk
assessment of patients with known or suspected CAD: Pro. 24:
1955-1959
(133) J Nucl Cardiol 2017; Stirrup JE, Underwood SR. PET should
not replace routine SPECT MPS for the assessment of patients
with known or suspected CAD. 24: 1960-1964
(134) J Nucl Med 2018; Murthy VL, et al. Clinical
quantification of myocardial blood flow using PET: joint
position paper of the SNMMI cardiovascular council and the ASNC.
59: 273-293
(135) J Nucl Med 2021; Slomka PJ, et al. Quantitative clinical
nuclear cardiology, part 2: evolving/emerging applications. 62:
168-176