Quantitative 3D breast image analysis of ductal carcinoma in situ (DCIS) on dynamic contrast-enhanced MRI (DCE-MRI) can potentially shed light on the prognosis of these often mysterious lesions, according to research presented at the recent RSNA 2013 meeting in Chicago.
Researchers from the University of Chicago found that two quantitative MRI characteristics in particular -- variance and time to peak -- offered the most value in distinguishing between pure DCIS and invasive cancer, and between pure DCIS and invasive cancer with a DCIS component.
"These features may be influential in identifying the likelihood of DCIS progressing to invasive disease," said presenter Stephanie Burda.
They also found that MR field strength can affect classification performance.
DCIS represents 20% of diagnosed breast cancers and can be solitary or associated with invasive cancer. DCIS may be aggressive or remain indolent, and this uncertainty can lead to overtreatment, subjecting some patients to unnecessary invasive procedures and radiation exposure, she said.
To inform the prognosis of patients presenting with DCIS, the researchers sought to determine the combination of computer-extracted quantitative image characteristics that would best complete the classification tasks of pure DCIS versus invasive cancer, as well as pure DCIS versus invasive cancer with a DCIS component. A secondary goal of the study was to assess the effect of magnet strength on these results.
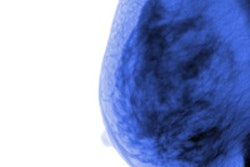
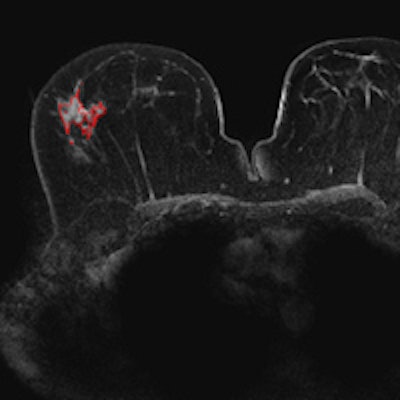
 Breast DCE-MR images acquired on a 3-tesla scanner. Top, pure DCIS; below, invasive with DCIS; bottom, invasive cancer. Shown in these slices are the computer 3D lesion segmentation results. Images courtesy of Maryellen Giger, PhD.

The study included 298 cases with DCE-MR images and pathology confirmation. Quantitative 3D image analysis was performed using semiautomatic lesion segmentation followed by extraction of morphological, kinetic, and texture lesion descriptors to gather image-based phenotypes.
Morphological features included homogeneity, margin sharpness, volume, and surface area, while kinetic features included time to peak, uptake rate, and washout rate. Three texture features (contrast, correlation, and maximum enhancement) were also evaluated.
The DCE-MR images were acquired on either a 1.5- or 3-tesla Achieva scanner (Philips Healthcare) using an axial acquisition plane, a 3D gradient echo pulse sequence, repetition time/echo time (TR/TE) of 5.5/2.7 (1.5T) or 5.0/2.5 (3T), a flip angle of 12° (1.5T) or 10° or 12° (3T), voxel size of 0.74 x 0.74 x 1 mm3 (1.5T) or 0.60 x 0.60 x 0.80 mm3 (3T), temporal resolution of 60 sec (1.5T) or 70 sec (3T), and six postcontrast acquisitions (both). Fat suppression and parallel imaging were performed on both systems.
Of the 298 cases, 191 were invasive, 53 were invasive with DCIS, and 54 were pure DCIS.
Receiver operator characteristics (ROC) analysis concluded that the best features (regardless of MR field strength) for distinguishing between pure DCIS and invasive cancer were as follows:
- Circularity
- Sum average
- Sum entropy
- Surface area
- Time to peak
- Total rate variation
- Variance
Those features yielded an area under the curve (AUC) of 0.91 ± 0.02.
Yielding an AUC of 0.82 ± 0.04, the best feature combination for distinguishing between pure DCIS and invasive cancer with a DCIS component included the following:
- Energy
- Irregularity
- Most enhancing volume
- Time to peak
- Variance
"Pure DCIS lesions tend to have higher variance, less circularity, lower contrast uptake rates, less enhancement at the first postcontrast time point, later times to peak, and a higher ratio of surface area to volume, with respect to invasive lesions and invasive lesions with a DCIS component," she said.
Without differentiation of magnet acquisition strength, the best performing features in both comparisons were time to peak and variance, the team noted.
The researchers noted that magnet strength affects image quality, which in turns affects feature calculation. Analysis based on MR magnet strength found that the best features (yielding an AUC of 0.93 ± 0.02) for 1.5-tesla acquisition for distinguishing between pure DCIS and invasive cancer were as follows:
- Contrast
- Correlation
- Difference entropy
- Measure of nonlinear gray-level dependence
- Circularity
For 3-tesla acquisition, however, the best combination of features (providing an AUC of 0.92 ± 0.03) for distinguishing between pure DCIS and invasive cancer consisted of the following:
- Maximum enhancement
- Time to peak
- Ratio of surface area to volume
As for distinguishing between pure DCIS and invasive cancer with a DCIS component, the best combination of features (yielding an AUC of 0.83 ± 0.05) for 1.5-tesla acquisition consisted of sum entropy, variance, and circularity. For 3-tesla acquisition, the best feature combination (providing an AUC of 0.86 ± 0.07) included enhancement at first postcontrast time point and effective diameter, the researchers reported.
"Analyzing cases within each magnet strength does cause a noticeable difference in classification task performance but does not change our conclusion, which is that image-derived quantitative phenotypes could potentially guide patient management of DCIS lesions and thus warrant further investigation," Burda concluded.