Lesion segmentation on PET/MRI studies can be challenging, but a team from the U.S. National Institutes of Health (NIH) has developed a software application that automates the process, making it easier for clinicians to identify boundaries between disease and healthy tissue.
In testing, the NIH software yielded accurate segmentation of both high radiotracer uptake areas and corresponding anatomical structures on PET/MRI scans, with results comparing favorably to manual lesion delineation.
"The presented automated computational tool can be employed for routine use in clinics, accurately identifying intricate boundaries between disease and healthy tissues using both anatomical and functional information," Ulas Bagci, PhD, from the NIH's Center for Infectious Disease Imaging, told AuntMinnie.com.
He described the approach during a scientific session at RSNA 2012.
PET/MRI offers the anatomical detail of MRI with the functional detail of PET, with less exposure to ionizing radiation than PET/CT. But characterizing disease severity in infectious disease and oncology requires better image processing tools for quantitative and qualitative analysis, Bagci said.
"Moreover, it is important that these tools be robust, accurate, fast, and reliable for clinical implementation," he said.
Image segmentation is the essential step for quantification of medical images, particularly for lesion/tumor segmentation. Inaccurate segmentation of a region of interest may distort the computed functional characteristics from PET images, affecting clinical applications such as radiation therapy, oncologic staging, therapy response assessment, and surgical planning, Bagci said.
"Furthermore, corresponding anatomical information and morphological measurements such as volume, area, and the length of the lesions, organs, tissues, etc., from structural images are also needed by clinicians for diagnosing and characterizing the disease type accurately," he said.
Current segmentation challenges
Most quantification methods in radiation oncology and computational radiology today rely on manual delineation, which is an inefficient and error-prone process, Bagci said.
It's also problematic to perform segmentation of lesions based on just one modality. PET-based lesion segmentation isn't reliable, as PET images generally lack anatomic context and are relatively low-resolution, Bagci said. Furthermore, existing PET image segmentation methods are based on thresholding techniques that have no clear consensus on the selection of an optimal threshold value for delineation.
On the other hand, segmenting solely from structural images also does not provide precise classification of tissues as healthy or diseased, because some tissue may still be interpreted as normal on MRI while being metabolically hyperactive on PET, Bagci said.
"There have been some attempts to develop software for manually incorporating anatomical knowledge from MRI or CT with functional data from PET; however, those studies have not achieved diagnostic feasibility," he said.
Simultaneous segmentation
As a result, the NIH team sought to develop a novel method for simultaneously segmenting functional and anatomical images, developing software that performs combined segmentation in two steps following initial coregistration of PET and MRI images.
First, the software performs a fast localization of high-uptake regions by computing 40% of the SUVmax value from PET images. The second step employs a novel delineation method based on "random walk" boundary detection techniques to find the optimal lesion boundary using textural properties from both PET and MRI images, according to the researchers. Total evaluation time from PET/MRI scans takes an average of 40 seconds.
"With our proposed approach, one can efficiently and automatically coevaluate functional localization of tissue uptake from PET images and precise extent of the abnormal regions in MRI," he said.
The researchers tested their method using PET phantoms; clinical PET studies; CT, PET/CT, and PET/MRI images; and a retrospective analysis of 10 PET/MRI studies performed on a Biograph mMR scanner (Siemens Healthcare) in patients with renal cell carcinoma and metastatic colon cancer.
The performance of the software was compared to that of two experts performing manual segmentations and graded using two measures of segmentation accuracy, Dice similarity coefficient (DSC) and Hausdorff distance (HD). Higher DSC values and lower HD values represent higher segmentation accuracy.
The automated method yielded a DSC of 86.9% and an HD of 5.09 mm for lesion segmentations.
Meanwhile, the scores for the experts were not as good, the researchers found. While intraobserver agreement was strong (92.63% DSC with 2.23 mm HD), the results were less promising for interobserver agreement (83.2% DSC with 7 mm HD). The latter figures highlight the thorny problem of interobserver variability in lesion segmentation.
"To the best of our knowledge, this is the first study jointly -- and accurately -- segmenting functional and anatomical images," he said.
Bagci noted that their method could also be used in PET/CT.
 |
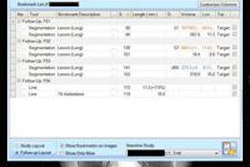
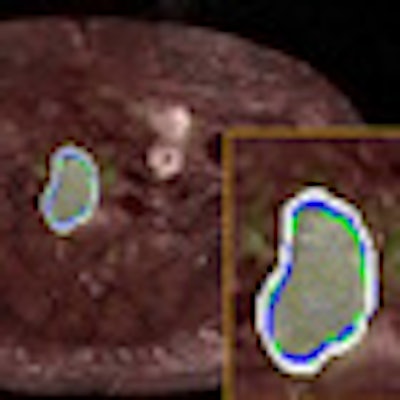
| For the images above, the same patient underwent both PET/CT and PET/MRI in two days. One slice from each (a) PET image of PET/CT, (b) CT image of PET/CT, (c) PET/CT cosegmentation, (d) PET image of PET/MRI, (e) MRI image of PET/MRI, and (f) PET/MRI cosegmentation is shown. The proposed cosegmentation method jointly delineates uptake regions from PET images and abnormal tissue regions from corresponding structural images simultaneously (white lines, c and f). Two expert observers' drawings are shown as surrogate of ground truths (blue and green). Segmented regions from PET/CT and PET/MRI images are rendered and overlaid in (g) (white and blue), respectively. The entire detection and delineation process take approximately 30 to 40 seconds on average per subject. All images courtesy of Ulas Bagci, PhD. |
"Recently, we tested our computational platform even for MRI/PET/CT-fused scans and obtained diagnostic accuracy levels," he said. "This fusion process is bringing the strength of each imaging modality into the evaluation platform and we quantitatively analyze all structures from different image modalities at the same time; hence, no separate evaluation and analysis platform is necessary."