A new image analysis technique for chest CT scans could have a big effect on the diagnosis and treatment of chronic obstructive pulmonary disease (COPD), according to a new study in Nature Medicine.
Called parametric response mapping (PRM), the automated technique compares inspiratory to expiratory CT scans of patients to determine the extent and location of COPD. The technique could enable physicians to distinguish early-stage damage to the small airways from the more extensive tissue damage of emphysema, said researchers from the University of Michigan in Ann Arbor.
Selecting better therapies
For the first time, the PRM technique enables clinicians to distinguish functional small airway disease (fSAD) from emphysema and normal lung function, said co-investigator Dr. Ella Kazerooni in an interview with AuntMinnie.com.
The result is not only better distinction of disease types, but eventually better selection of therapies best suited to the patient's individual disease type.
"Functional small airway disease measured with PRM technology allows us tremendous insight into classifying COPD, which we hope will translate into more patient-specific individualized treatments and better outcomes in the future," she said.
The PRM technique relies on computer analysis of CT scans acquired at inhalation compared with scans acquired at exhalation.
The overlaid image sets, representing the inflated and deflated lungs, allow researchers to create 3D maps of the lungs and compare images density (in Hounsfield units [HUs]) voxel by voxel between healthy lung tissue, which displaces during inhalation, to diseased tissue, which does not, the authors explained (Nature Medicine, October 7, 2012).
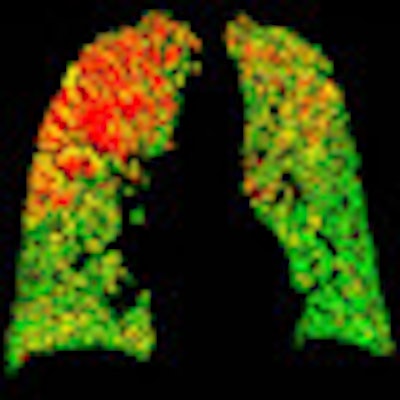
PRM color codes each voxel to represent signal changes between the two scans. Green means healthy, deformable tissue (HU ≥ -900); yellow means a reduced ability to push air out of the small air sacs (fSAD); and red represents severely reduced capacity to exhale (COPD).
 PRM attenuation-based analysis of CT data shows normal lung voxels in green, yellow voxels as small airway disease, and red as COPD. Above, image at left shows a large area of COPD in red in the upper left lobe, while the image at right is dominated by yellow voxels depicting functional airway disease interspersed with red voxels indicating COPD. Patients with diffuse small airway disease (yellow) may be better candidates for pharmacologic rather than surgical treatment approaches, while more invasive therapies such as lung reduction or lung transplantation might be reserved for patients with large COPD (red) components. Below, left image shows mostly normal lung tissue color-coded in green, while right image shows evidence of diffuse small-airway disease. All images courtesy of Dr. Ella Kazerooni and the University of Michigan.
Put the colors together in a map and you can determine the patient's breathing capacity, or conversely the extent of emphysema, region by region and voxel by voxel.
"What people have not had a good way of measuring is this functional small airway disease," Kazerooni said.
When people breathe in, the lungs should fill up; when they breathe out, the lungs should get smaller; and the changing HU numbers reflect that change between inspiration and expiration, she said. On inspiration, the HU number gets lower, showing more white on CT, and on expiration the HU number gets higher, showing more black on CT. Diseased lung tissue doesn't inflate, remaining more black.
"What the PRM technique has allowed us to do is to look at patients' lungs when they actually breathe," Kazerooni said.
The change between how the lung looks during full inhalation and exhalation at CT represents the fSAD component, which was never measured robustly until the PRM technique was applied.
"Once you understand the extent of the three major components of COPD -- emphysema, airway thickness, and PRM -- you can figure out if somebody is really at end-stage COPD with lots of emphysema, or if somebody has got some functional small airway disease and might be candidates for some of the newer -- and very expensive -- medications that have been developed for COPD," Kazerooni said.
The pilot study of 194 individuals with COPD from the COPDGene study aimed to determine if PRM corresponded to spirometry measurements of lung function. The subjects all had a minimum of 10 pack-years of smoking history.
PRM not only identified the extent of fSAD and emphysema, it provided CT-based evidence to support the concept that fSAD precedes emphysema with increasing COPD severity, Kazerooni said.
PRM pinpoints functional airway disease
The automated PRM technique was easier to perform and the results more robust than a study the group performed last year that measured airway thickness and compared it to spirometry measured as forced expiratory volume (FEV1).
The traditional method, spirometry, is "very global and very general," Kazerooni said. "It doesn't really tell you what's going on in the lungs."
Two individuals could end up with the same spirometry score but have completely different disease states -- one, for example, with emphysema in the upper lobes and healthy tissue in the lower lobes, versus a patient with diffuse disease or fSAD, dispersed more or less evenly throughout the lung tissue.
With PRM you can determine the extent of both, she said.
"And if you can measures small functional airway disease, we can see how people are doing when their disease is at a less severe state, and hopefully intervene before their disease gets worse," she said.
The study team calculated PRM as a percentage of lung tissue categorized as normal, emphysema, or fSAD. A subset of results in four patients shows how PRM goes beyond current techniques for diagnosing the extent, severity, and localization of COPD.
PRM results compared with spirometry and GOLD classification in 4 patients
|
|||||||||||||||||||||||||||||||||||
| GOLD = Global Initiative on Obstructive Lung Disease Percentage emphysema is the relative volume of lung tissue with attenuation ≤ -950 HU. |
|||||||||||||||||||||||||||||||||||
Subjects B and C had almost the same FEV1 measurements (55 and 59), but subject B had a higher percentage of emphysema (19%) compared with subject B (5%), the authors wrote. The clinicians were unable to provide a GOLD classification for subject B, leading the researchers to conclude that the patient's COPD is primarily due to airway obstruction.
PRM measurements showed that 26% of the lung tissue in subject B was fSAD tissue localized primarily in the upper lobes of both lungs, with minimal signs of emphysema.
In subject C, PRM analysis showed that emphysema had progressed throughout the upper left lung, identified by the low attenuation on the inspiratory CT scan. PRM identified and quantified fSAD in the patient's right upper lobe, which would have been missed by current clinical diagnostic methods such as percentage of emphysema, the authors wrote.
Subject D, with a GOLD 4 COPD status, had a PRM signature distinct from the normal status, with most voxels in the fSAD (yellow) and emphysema (red) classifications.
"PRM showed us differences in patients that measuring just emphysema or just airway wall thickness could not find," based on how the lung is functioning during inspiration and expiration, Kazerooni said.
"So you can have areas on a regular inspiratory CT that look normal but don't function," she said. "If you apply the emphysema [criteria], the values come out normal. If you look for airway thickness, the airways might look normal. But functionally when the person is actually breathing, it's not working."
The color-coded PRM data correspond to spirometry results, and the more abnormal a patient's spirometry results, the more abnormal the PRM data, so the results provide some validation based on normal individuals and those with mild-to-severe disease, she said.
PRM was also a better marker of functional impairment than airway wall thickness, which was shown to be a very poor measure of lung function, she said.
To examine the feasibility of PRM as an imaging biomarker to monitor individuals over time, the group examined subjects outside the COPDGene study who had previously undergone an inspiratory/expiratory CT scanning protocol.
Over the 11-month mean follow-up period, the researchers found evidence that fSAD was progressive in some patients, with changes of normal lung to emphysema corresponding to decreases in FEV1, and regressive in others, who showed increases in fSAD tissue over time and increases in lung function.
These analyses demonstrate the potential of using PRM to follow COPD over time and provide a phenotype classification basis for patient response or progression, they wrote.
A patient with large localized areas of emphysema might be a candidate for lung reduction or lung transplantation surgery, while patients with a lot of small airway disease might be targeted for treatment with some of the new COPD drugs.
"If you can map them and figure out what they have, targeted drugs might prevent them from ending up with emphysema," Kazerooni said.
A key benefit of PRM compared with other modalities is its potential to localize disease and identify the progression pathway, the authors wrote. PRM's signature for each individual is unique, and PRM has a potentially very large population for analysis.
And as about 5% of COPD patients are found to have lung cancer, PRM analysis will likely be a useful adjunct to lung cancer screening, she said.
What's on the research agenda after publication of the Nature Science study? Co-author Brian Ross is collaborating with a University of Michigan spin-off firm Imbio to develop the technique into a U.S. Food and Drug-approved tool, Kazerooni said. That process will involve larger numbers of patients than were used for this pilot study, which demonstrated the feasibility of the technique.
|
Study disclosures Co-authors Craig Galban, Alnawaz Rehemtulla, and Brian Ross have a financial interest in the technology that the University of Michigan has licensed to Imbio for development of the commercialized software tool. Funding for the study was provided by the National Institutes of Health. |