With its flashy sequences and high-speed protocols, there's no shortage of razzle-dazzle in MRI. But learning to make the most of cutting-edge imaging techniques often involves going back to basics. In the case of susceptibility-weighted imaging (SWI), that means turning one's attention to the oft-neglected phase image.
"SWI is something that we've all perhaps heard of before, in the sense that we use gradient-echo images which are T2*-weighted images. But normally we throw away phase information," said E. Mark Haacke, Ph.D., a professor of radiology at Wayne State University and director of The MRI Institute, both in Detroit.
"When I'm teaching a course on MRI principles and sequence design, I try to instill in the students that there is one thing that they need to walk away with -- they need to understand phase. If they understand phase, they'll understand most of MR," Haacke added.
The phase image is the key to unlocking the secrets of SWI. Furthermore, Haacke discussed the groundbreaking relationship between SWI and new image-contrast mechanisms during a lecture in late August at the San Francisco VA Medical Center.
In brief, SWI measures susceptibility differences between tissues, offering a new form of contrast enhancement. When these phase effects are caused by small pixel-sized objects, signals from substances with different magnetic susceptibilities can become out of phase at long echo times (TE) compared to neighboring tissues, Haacke and colleagues explained in a recent paper (Magnetic Resonance in Medicine, September 2004, Vol. 52:3, pp. 612-618).
Haacke started his VA talk with a quick definition of phase. "The phase represents how much distance in radians a spin precesses over a given time," he said. "Phase is basically proportional to the main magnetic field and time. If we have variation in the background field, it's the change in that magnetic field, induced by the tissues, that gives us new information."
Haacke described SWI as the combination of magnitude images and phase images merged into a new image. He outlined a formula for how the specially processed phase images are derived through a high-pass filter and then a special phase mask.
"We take the phase image, and say 'For all phases that are positive, make it 1. For all phases that are negative, running between -π and zero, make the filter zero if the phase is -π and 1 if the phase is zero (all other values in between scale linearly between 1 and 0),'" he explained.
"What that means is that if all phases were positive, then I would create a new image called a phase mask, and that mask is going to be 1 everywhere in this simplistic case. Multiplying this phase mask times the original magnitude image would do nothing. However, when the phase mask values are less than unity -- as is the case near vessels, clots, and iron -- this multiplication will modify the intensity in the original magnitude image, yielding new contrast."
The areas in which this new information can be gleaned with SWI involve better visualization of blood vessels, clots, subtle differences in tissue type, and iron-laden tissues.
Gray matter-white matter
Haacke's group has found that SWI in the brain offers "amazing" contrast on a 1.5-tesla unit, and even better results on 3-tesla or 4-tesla systems.
"You have excellent gray matter-white matter contrast from phase images at long echo times in areas of high iron concentrations. At 3-tesla or 4-tesla, the contrast-to-noise ratio and resolution are even better. The implications for this turn out to be rather significant for T1-weighted imaging. As you are getting down to the central sulcus, you don't have quite as good contrast. It has been shown that the T1 values of gray matter by the motor cortex have, in fact, reduced closer to those of white matter," he said.
The reason for this reduction may be attributable to the increased iron content in these areas, Haacke explained. The iron can act like a paramagnetic contrast agent and shorten T1. SWI can use this phase difference to enhance the T1 contrast in an image (see below).
 |
| An example of increased brain iron in gray matter changing local T1 as conceived by Robert Ogg, Ph.D., St. Jude Children's Research Hospital, Memphis, TN. The arrow shows the gray matter in the central sulcus. Note the poor contrast in the T1-weighted image and the excellent contrast in the phase image. Data collected on a 1.5-tesla system (Vision, Siemens Medical Solutions, Malvern, PA) with a TE = 40 msec by Larry Gates, Ph.D., Dalhousie University, Halifax, Nova Scotia. |
 |
One potential application for SWI is in Alzheimer's disease. In humans, a large iron store is associated with the motor cortex, the basal ganglia, and other parts of the parenchyma. It increases rapidly during the first 10 years of life, slows down during the next decade, and then levels off, Haacke said.
"What if we could measure iron levels in an Alzheimer's patient? I would take the image from the first year, and then I'd take the image from the second year, and look for changes in phase as a marker for local iron content. We may be seeing something like this in the basal ganglia, particularly in the red nucleus and perhaps substantia nigra and globus pallidus. Would that correlate with something affiliated with the pathology of Alzheimer's disease?" he asked.
Finally, different echo times can be used to highlight gray matter-white matter contrast. "At 1.5-tesla, T2* of gray matter was about 70 msec. T2* of white matter is 60 msec. At 4-tesla, these become 40 msec and 50 msec, respectively. This leads to a reversal of T2* effects. The T2* of gray matter is now shorter than that of white matter."
"That's wonderful," Haacke said. "Imagine if we did a TE = 10 msec scan at 4-tesla, which is rather long for this field strength. We are going to lose more signal from the gray matter than from the white matter. So we are automatically going to enhance T1 contrast even without varying the flip angle to make it a T1-weighted image," he said. "It turns out that we can truly generate some very interesting contrast even by varying the echo time at 4-tesla."
Vessel mapping
SWI had its start in imaging the veins in the brain. Perhaps some of the most exquisite small vessel imaging in vivo has been presented using SWI, Haacke said.
The beauty of SWI in these patients is its ability to image indirectly vessels that are a fraction of a voxel in size. Haacke showed an image acquired on a 3-tesla unit with an in-plane resolution of 0.5 mm x 0.5 mm with a 1-mm slice thickness. Haacke has recently used SWI on a 4-tesla system to see the small veins of the medial venous drainage system (see below).
 |
| SWI data on a 4-tesla unit. In-plane resolution 0.5 mm x 0.5 mm projected over 18 slices of 1-mm slice thickness. Data acquired with a TE = 15 msec. More vessels could be shown if a longer TE had been used, such as 30 msec. This data was collected at Wayne State University in Detroit on a Bruker-Siemens 4-tesla unit. |
Another potential application of SWI is in vessel wall imaging. "Using SWI, we may be able to image atherosclerosis at a resolution on the order of 250 microns. You can see the vessel wall quite clearly with filtered phase images," he said.
"The vessel wall itself appears to be slightly diamagnetic. What would happen if there were bleeding inside the vessel wall? It would be ferromagnetic. The question is how small a bleed can we see? Down to 100 microns, perhaps," Haacke continued.
Calcified plaque is another condition that is diamagnetic and, thus, potentially seen by SWI rather than traditional imaging, Haacke added. "This pixel by pixel spectroscopic imaging approach may end up giving you one of the best ways to determine what type of plaque is present in the vessel wall."
Haacke cautioned that obtaining images at the right resolution is vital to SWI. The wrong resolution may yield unsatisfactory results. With SWI, Haacke said his group is working to test the limits of high-resolution MR.
"We'd like to push the resolution from 1 by 1 by 1 mm3, which is already pretty good, to perhaps 0.5 by 0.5 by 1 mm3," he said. "This (1 x 1 x 1 mm3) standard has been valid for almost 15 years. My prediction is that if we can get this to 0.5 by 0.5 by 1 mm3, the protocol will be good for a long time to come and, therefore, valuable for many clinical studies. This should be viable with the conventional gradient-echo T1 methods, MRA, and SWI."
Stroke and trauma
SWI also could be invaluable in stroke and trauma imaging. Haacke offered up examples of both.
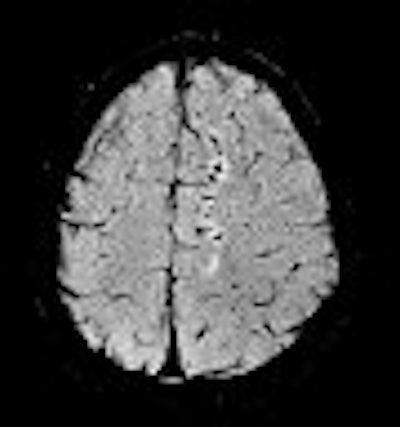
In traditional diffusion-weighted imaging (DWI) for stroke, "you'd look at this for cellular disruption, and you'd see quite clearly the major region affected by the stroke," he said. "DWI is often very broad. In the SWI image, you are seeing evidence of dramatic changes in oxygen saturation and maybe other sources of susceptibility. We can see the source of the stroke and maybe the vascular territory affected (see below). The hypothesis is that the deoxyhemoglobin content of the small vessels has increased over their normal values due to slower or restricted flow, making these (vessels) visible when they would normally not be visible."
 |
| Stroke imaging with SWI. Although the DWI image (above) shows the affected region well, the details of the stroke are shown in the SWI image (below). Images courtesy of Dr. Daniel Wycliffe, Loma Linda University, Loma Linda, CA. |
 |
He also presented a trauma case comparing 2D conventional gradient-echo imaging (TE = 20 msec) and SWI. The patient had an accident and suffered subsequent cognitive impairment.
"This is where SWI lets you start seeing very small, almost pixel-like effects, probably microhemorrhages where there may be damage," he said. "Conventional gradient-echo imaging didn’t show any effects, but on the SWI you could see evidence of microhemorrhages and edema (see below). In most cases, you will see something with SWI that you won't see with conventional imaging. It could have significant impact in trauma imaging because you'd like to know what's wrong with them, and whether they are going to get better."
 |
| Diffuse axonal injury in trauma. GRE image above; SWI image below. Data was collected on a 1.5-tesla scanner (Vision, Siemens Medical Solutions) with a TE = 40 msec and a resolution of 0.5 mm x 1.0 mm by 2.0 mm. Images courtesy of Dr. Karen Tong, Loma Linda University. |
 |
For more information, Haacke referred to a 2003 study by Dr. Karen Tong and colleagues at Loma Linda University Medical Center in Loma Linda, CA. The authors, including Haacke, compared the effectiveness of SWI MR to conventional GRE MRI for the detection of hemorrhage in children and adolescents with diffuse axonal injury (Radiology, May 2003 Vol. 227:2, pp. 332-339).
Haacke concluded by emphasizing that SWI is not meant to replace other MRI techniques, but rather to complement them. In the brain, the goal of an SWI exam would be to look for changes in venous vasculature, microbleeds, and changes in local iron content. SWI may even serve as an important morphological scan to go along with T1-weighted images for functional MRI studies as well.
"SWI simply adds to that arsenal of weapons that we have in MRI," Haacke said.
By Shalmali Pal
AuntMinnie.com staff writer
September 15, 2004
Images provided to AuntMinnie.com by E. Mark Haacke, Ph.D.
Related Reading
MR vs. CT? Stroke imaging hinges on more than modality, August 25, 2004
MRS predicts severity of brain injury in abused infants, June 10, 2004
Focus of TLE seizure clarified with MR plus diffusion tensor imaging, June 9, 2004
DWI proves best of seven in subacute stroke imaging, May 17, 2004
Copyright © 2004 AuntMinnie.com