SAN FRANCISCO - Researchers at the 2007 International Stroke Conference are making progress toward the goal of standardizing imaging and clinical criteria for the optimal treatment of stroke patients.
When a stroke patient arrives in the emergency department, doctors want the tools to decide -- accurately, empirically, and very quickly -- if the patient will benefit from therapies such as thrombolysis enough to offset the risk of intervention.
Taking aim at one piece of the puzzle, researchers at Massachusetts General Hospital in Boston have found that CT perfusion (CTP) results correlate very closely with diffusion-weighted MRI (DWI) imaging for determining the acute infarct core -- but only when a relative cerebral blood volume (CBV) threshold is used to compare the CT and MRI results. By relative, the group means comparing the CBV of the infarct core to that of the presumably normal contralateral side of the patient's brain.
The preliminary results are good news for CT perfusion imaging, which is faster and generally more available than MRI to handle emergent stroke cases.
The Boston team's results contrast somewhat with the conclusions of Wintermark et al, who reported last year in Stroke that the perfusion CT parameter that most accurately describes the infarct core on admission is the absolute cerebral blood volume (CBV) (area under the curve = 0.927), "with an optimal threshold at 2.0 mL x 100 g(-1)," (Stroke, April 2006, Vol. 37:4, pp. 979-985).
Dr. Michael Lev, an associate professor of radiology at Harvard Medical School in Cambridge, MA, and director of neurological CT at Massachusetts General Hospital, spoke with AuntMinnie.com about the group's poster study on Wednesday.
"By using a relative threshold comparing it to the contralateral normal area, you're actually comparing gray matter to gray matter and white matter to white matter," Lev said of the new method. "What we found was not only did the relative threshold give a closer correlation to what we saw on the DWI, but also that the relative threshold of approximately 50% gave the best correlation compared to other thresholds."
"Automated segmentation of infarct core on CT-CBV maps is possible using commercially available software; a threshold of 2 cc/100 g has been advocated as optimal," study authors Dr. Shamir Kamalian, Dr. Pamela Schaefer, Lev, and colleagues wrote. "Because, however, the baseline CBV values for gray and white matter differ by a factor of two (roughly 4 cc/100 g gray matter and 2 cc/100 g white matter), we hypothesized that relative rather than absolute CBV thresholds for the core would more closely correlate with DWI findings. In this study, we therefore compared core lesion volumes, automatically segmented using various CT-CBV levels, to those of manually segmented DWI lesions."
The researchers examined 31 consecutive cases of anterior circulation infarction. All of the patients underwent CT perfusion upon admission and DWI within three hours of CT (some tests were within 15 minutes of each other, many others about an hour, and DWI was the first modality in two cases).
The CTP maps were postprocessed with software that relies on the central volume principle and applies deconvolution to calculate the mean transit time map, the authors wrote. Then the CT-CBV lesions were automatically segmented using an absolute threshold of 2 cc/100 g, and relative thresholds of 46%, 56%, and 66% (as a percentage of CBV in the normal, contralateral "mirror" region).
The researchers might have chosen 40%, 50%, and 60%, Lev said, but 46%, 56%, and 66% were the default settings on the research version of the CTP analysis software (Philips Medical Systems, Andover, MA).
The MR images were co-registered using Analzye 7.0 software (Mayo Clinic, Rochester, MN) to match the spatial position and axis orientation of the CT perfusion images, the authors explained. The co-registered DWI lesions were manually segmented at the same levels as the CT perfusion maps by a reader who was blinded to the CT-CBV findings, and lesion volumes were compared by Pearson linear correlation.
The final infarct volume ranged from 0-170 cc (mean 38 cc). All of the relative thresholds resulted in excellent correlations between the CT-CBV and DWI lesion sizes, Lev said.
According to the results, the coefficients of determination (r²) and slopes for relative thresholds of 46%, 56%, and 66% were r² = 0.85/slope = 1.04; r² = 0.89/slope = 1.01; r² = 0.89/slope = 0.95, respectively: all p < 0.01. The correlation using the absolute threshold was weaker (r² = 0.77/slope = 0.82, with CBV smaller than DWI, p < 0.01).
"So when the cerebral blood volume is reduced by about 50% from normal hemisphere, you get the best estimate relative to DWI," he said.
 |
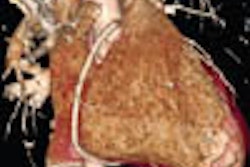
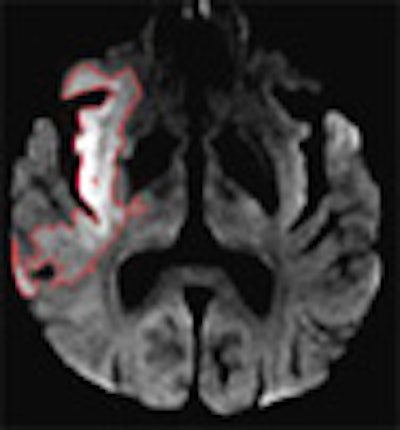
| DWI and CT-CBV images from an 80-year-old patient who presented with left-sided hemiparesis and aphasia 1.5 hours after stroke onset. CT perfusion (CTP) was performed at admission to the emergency department, followed by MR-DWI 40-minutes later. Image A shows the admission DWI lesion. Images B and C show the automatically segmented CT-CBV lesions that optimally correspond to the DWI lesion, using an approximate threshold of 56% reduction in blood volume compared to the contralateral uninvolved side (the fully automated CTP map segmentation was performed using software from two different commercial vendors). All images courtesy of Dr. Shamir Kamalian and Dr. Michael Lev. |
In this heterogeneous group of anterior infarction cases, relative more than absolute CT-CBV thresholds were highly correlated with DWI in the acute determination of infarct core, the authors noted.
"This is likely due large to the difference between gray and white matter in baseline normal CBV values," they wrote. "Despite a very similar r² for relative thresholds of 56% and 66%, the former shows a slope closer to 1, and the latter yielded several visible false-positive regions (red on the maps, but normal in DWI) in 14 patients. Based on our results we suggest the use of a relative threshold of 56% for automatic segmentation of infarction core."
By using a relative threshold, "we're getting rid of much of the variability in the normal baseline values," Lev said. "Part of problem with a single absolute threshold defining the ischemic region for infarct is that 'normal' varies from individual to individual, normal values vary from gray matter to white matter, and the actual quantified values of the CTP maps have some intrinsic error to them, probably around 20% to 25%. So it makes sense to use a relative threshold where the contralateral side is essentially serving as a baseline CBV."
Still, Lev added, the 2006 Stroke paper was accomplishing something quite similar by using an absolute CBV threshold of 2 cc/100 g, which amounts to about 50% of the typical gray-matter CBV of 4 cc/100 g.
The Massachusetts group's method won't work if there's an infarct on the contralateral side, of course, so one would still have to use an absolute value formula in the event of bilateral stroke. And even if there is no contralateral infarct, in the presence of complex anatomy, automatic segmentation of ischemic regions may be inaccurate due to volume averaging, the authors cautioned.
Finally, the skull produces a halo artifact that results in different density measurements for cortical and deep gray matter. "Because this may lead to variation in baseline quantitative CTP values, a single absolute threshold may not be appropriate for all regions," they wrote.
More-standardized therapies and protocols are not far off, Lev said.
"For the types of things that we need to do -- extend the time window for thrombolysis, make treatment decisions about enrolling patients for novel therapies and enrolling patients in clinical trials -- it almost will be a moot point whether you use CT or MRI," he said. "I think the important thing will be whether you're using functional CT or functional MR."
"I think the future is going to be some measure of mismatch -- to be able to define how much brain is dead at admission, how much brain is at risk but potentially salvageable, what are the vessels that are occluded, what are risks of hemorrhage -- those are the big imaging questions. And I think we're making good progress toward answering those."
A National Institutes of Health (NIH)-sponsored perfusion imaging meeting to be held September 7-8 in Washington, DC, will address all of these issues, Lev said.
By Eric Barnes
AuntMinnie.com staff writer
February 9, 2007
Related Reading
MRI should be preferred test for suspected acute stroke, January 26, 2007
Ultrasound shows vessel patency after TPA for stroke, predicts outcome, January 17, 2007
Radiation dose can add up in CT stroke imaging, December 1, 2006
MRI profiles predict utility of reperfusion therapy for stroke, November 22, 2006
MRI helps identify ischemic stroke patients likely to benefit from tPA, May 8, 2006
Copyright © 2007 AuntMinnie.com