A survey of the latest nodule-detection studies finds that lung CAD algorithms have evolved to become unmistakably useful to radiologists. In nine studies presented at the 2003 RSNA meeting in Chicago, CAD schemes developed by multimodality vendors and independent firms alike all brought significant sensitivity gains to the tedious job of lung-nodule detection.
That said, radiologists needn't fear a usurpation of their roles as doctor and adjudicator, at least not anytime soon. The algorithms that flag suspicious lesions today have good eyes but simple brains, making no distinction, for example, between high- and low-risk patients, or individual nodules compared to lesion clusters. CAD doesn't worry about ground-glass opacities or part-solid lesions either -- that's the radiologist's job.
But lung CAD applications do excel at finding small abnormalities, lots of them, even while bypassing a few uniquely human foibles such as reader fatigue and discovery bias. The four studies outlined below are representative of the state of the art in automated lung-nodule detection.
Immediately after accepting an RSNA honorarium for "Best Chest Study, 2003," Dr. Kersten Peldschus from Brigham and Women's Hospital in Boston and Hannover Medical School in Germany presented his group's award-winning work: a CAD-based review (ImageChecker CT, R2 Technology, Sunnyvale, CA) of 100 chest CT studies that had initially been read as normal.
"The goal of this particular study was to explore the usefulness of CT for user perception error, and its potential (effect) on patient management," Peldschus said. "From recent studies we know that the CAD algorithms for automatic detection of focal lung lesions have the potential to improve reader accuracy, and they also have the potential to improve reader effectiveness...and consistency. All of these studies were interpreted as normal, without focal lung lesions at routine clinical readout, and...were reconstructed with slice thickness ranging from 1.25-3 mm, resulting in 241 individual axial sections per case."
 |
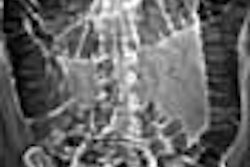
| Contrast enhanced spiral CT study in a 49-year-old woman with a history of colon cancer. A 7-mm soft tissue lung lesion was missed at clinical interpretation but detected by CAD. The location of the lesion in the immediate vicinity of lung vessels of similar size may have prevented its detection at the initial readout. A yellow line indicates the anatomical level of the displayed section within the volume data set in a coronal maximum intensity projection of the pulmonary vascular tree (left upper image panel). 3D volume rendering (left lower image panel) of the lesion highlighted in green displays the spatial relationship of the lesion relative to surrounding vascular structures and enables better differentiation of focal lung lesions and vessels than individual axial sections. Image courtesy of Dr. Joseph Schoepf. |
 |
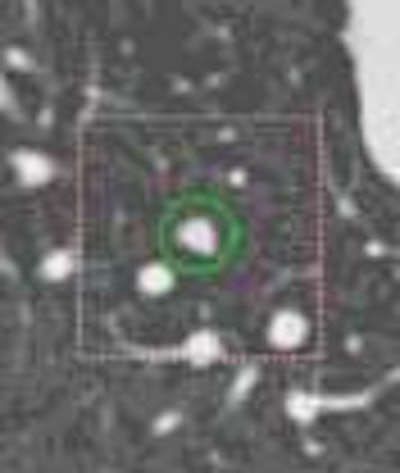
| Contrast enhanced spiral CT for routine follow-up in a 56-year-old woman with a history of breast cancer. Transaxial section at the level of the right phrenico-costal angle. A yellow line indicates the anatomical level of the displayed section within the volume data set in a coronal maximum intensity projection of the pulmonary vascular tree (left upper image panel). An 11-mm, part-solid slightly spiculated soft tissue lung lesion was missed at clinical interpretation but detected by CAD. 3-D volume rendering (left lower image panel) of the lesion highlighted in green displays the anatomic location of the lesion in the dorsal right phrenico-costal recess. Image courtesy of Dr. Joseph Schoepf. |
Patients were divided into three groups, according to indications for undergoing CT. Group 1 consisted of 53 patients with suspected pulmonary embolism. Group 2 consisted of lung cancer screening patients, a high-risk population of smokers with 20 or more pack-years. Group 3 included 39 chest CT patients with a history of malignancy.
Each case was processed by the CAD system as a second reader. The CAD system detected 285 lesion candidates, further classifying them by size alone to determine the "significance" of each candidate: 4 mm and smaller for low, 4-10 mm for intermediate, and > 10 mm to indicate high significance, Peldschus said.
The CAD-processed datasets were then examined by two thoracic radiologists, with a third as adjudicator, who applied more stringent evaluation criteria. The radiologists defined as "actionable" all circumscribed solid, part-solid or non-solid parenchymal lung lesions that were not associated with atelectasis or adenopathy. "Intermediate" meant a benign calcified pattern or non-nodular appearance, i.e. apical/subpleural scarring, and "low actionability" lesions signified false-positive lesions on CAD.
CAD revealed 285 candidate lesions, 125 of which were dismissed outright by the human readers. Of the remaining lesions, five (9.6%) were deemed "actionable," and 16 lesions in 22 patients (42.3%) as "intermediate." Twenty-five lesions (48.1%) had "low actionability."
Among suspected PE patients (Group 1), six (17.6%) had lesions of high (n=1) or intermediate (n=5) actionability. Among the smokers, eight had high (n=2) or intermediate (n=6) lesions. In patients with a history of malignancy, seven (24.1%) had high (n=2) or intermediate (n=6) actionability lesions.
"Most of these missed lesions (of intermediate and high actionability) were located in the central areas of the lung, close to the adjacent vessels," Peldschus said. "When we look at these 53 (actionable) lesions, you can see there is a high number of low-significance lesions in the first group (PE), and that the total number of lesions in the second group, the (lung cancer) screening group, was clearly the lowest."
Lung lesions are frequently missed during routine clinical examination of thoracic CT images, he said, while CAD as a second reader is able to detect significant lung lesions, with a possible impact on patient management.
"CAD as a second reader based on a consistent detection algorithm may offset human variation as a source of perceptual error," he concluded.
An audience member remarked that calling the CAD-detected lesions "significant" based on size alone was confusing, to which Peldschus agreed. Applying a more-neutral term such as "size category" to CAD findings would serve to differentiate them from lesions deemed significant by radiologists, the audience member said.
Fewer perceptual errors
A second study examined whether the use of CAD could reduce the number of perceptual errors in the interpretation of chest CT studies. The second study also utilized R2's ImageChecker system, which is currently pending FDA approval.
"We also had a second objective, which was to measure the potential reduction in observational oversight of solid lung nodules while reading these CT exams," said Kathryn O'Shaughnessy, Ph.D., of R2 Technology, who presented the study.
The study examined 122 thoracic CT exams covering the normal range of clinical indications. Ground truth for each case was established by a consensus panel of three experienced thoracic radiologists, who examined each quadrant and deemed it positive if it contained at least one nodule 4 mm in diameter that the panel found actionable, i.e., required immediate intervention or surveillance. The 122 cases were then divided into four lung quadrants each, for a total of 488 quadrants.
"After the consensus panel, there were 102 positive findings in 105 of the 488 quadrants used for statistical analysis," she said. "We excluded cases with nodules greater than 10 mm (from subsequent analysis) because we felt there wasn't a detection issue at that point," O'Shaughnessy said.
After the CAD system had finished its work, five radiologists with a minimum of six months' experience reading thin-section CT exams independently examined 15 quadrants each, first without, then with, the CAD system. The areas under the ROC curve (Az) were calculated and compared for both scenarios using a paired t-test.
"Communication between the CAD system and the workstation is via the DICOM standard," O'Shaughnessy explained. "The processing segments anatomical structures such as vessel wall, and searches for the SPNs (solid pulmonary nodules) in the size range indicated. It also identifies the location and the characteristics -- the average density volume and the diameter of the candidate nodules. On average it takes 3-5 minutes to process one of these cases, and we had a median of two false positives per case, averaging 200 slices (each)."
Before-and-after comparisons of the area under the ROC curve showed significant improvement when the radiologists worked with CAD (pre- and post-CAD Az: 8997 versus 8778, respectively, p=0.0013), O'Shaughnessy said. Dorfman-Berbaum-Metz ANOVA and bootstrap analysis methods showed an approximate 23% reduction in detection errors without a substantial increase in false positives. The improvement held when the analyses were performed with looser and tighter definitions of ground truth, yielding similarly positive results (p<0.05), she said. Moreover, the performance improvement was consistent in radiologists with both high and low pre-CAD performance. The 4-mm size threshold was chosen to ensure that minimum lesion size was appropriate to the CT slice thickness.
"The CAD system significantly improved radiologists' ROC performance for detecting solid pulmonary nodules 4-30 mm in diameter," O'Shaughnessy said. "The increase in the area under the curve (Az) with the use of CAD can be interpreted as a 23% reduction in missed nodules. That value changes a little bit based on your assumptions, but it's in the mid-20% (range). And the improvement in performance is a result of readers' ability to reduce their detection errors while easily dismissing the false (-positive) marks."
An audience member asked how well the system could be expected to perform in the detection of nonsolid nodule types such as ground-glass or semi-solid lesions, which can also be clinically important.
"We do have some examples of (semi-solid nodules) in our case set; however, we were asking the radiologists to focus on the solid nodules, and that meant that the peak Hounsfield unit density of greater than -100 was (used to) define the difference between solid and nonsolid. We focused our CAD algorithm, the first generation, on the solid nodules."
In a third presentation, the FDA-approved Siemens ICAD-L lung CAD scheme was used to evaluate 80 thin-section CT datasets representing a mix of routine indications.
The group, from the radiology department of Ludwig-Maximilians University in Munich, used a 16-slice scanner (Sensation 16, Siemens Medical Solutions, Erlangen Germany) to acquire data using 1.5-mm collimation, reconstruction slice thickness of 2 mm, and 1.5-mm overlapping increment."
"The radiologists were all board-certified, but they were by intention not dedicated thoracic radiologists," said Dr. Peter Herzog, explaining that non-specialist radiologists might presumably be more typical readers of chest studies using CAD.
"They marked every finding on a special evaluation form regardless of size or clinical significance," he said. "All this data was then transferred to a consensus panel, which established a consensus of truth using the findings from the readers and the computer. They were also looking for additional nodules using special visualization techniques."
Eight hundred twelve nodules were picked up by the radiologists working with CAD. About half of these were picked up only by the CAD tool. Of these, 20% were picked up only by the human reader, while 18% were seen by both the CAD and the human readers, Herzog said.
"Twelve percent were missed by the computer and the readers but found by the consensus panel," he said. "If you look at the size distribution of these nodules found by the computer...and compare (it to) the size distribution found by the human reader, you see that the computer had the advantage in all diameters in finding these nodules."
Readers found nine times as many small nodules (< 4 mm) when aided by CAD. They found five times as many of the 42 intermediate-sized nodules (4-8 mm) with CAD than without. Owing to the large number of small nodules in the dataset, reader sensitivity was only 39% without CAD, but rose to 88% when CAD was added, for an increase of 49%, Herzog said.
On average, however, three nodules per case (of an average 10 nodules total per case) were false positives, and had to be eliminated by the human readers. In one case, the CAD tool called a lung nodule where the consensus panel found only a normal bronchial structure. In another case, CAD missed a pleural lesion.
 |
| Above, false-positive lesion detected by ICAD-L was actually mucus in bronchus. Below, true negative nodule detected by the reader and ICAD-L. Images courtesy of Dr. Peter Herzog. |
 |
"To conclude, we think that CAD tools can increase the number of nodules found by radiologists drastically (p< 0.001)," Herzog said. "We still have to cope with a fairly high number of false-positive findings, that have to be dismissed by the human readers." And owing to CAD's inability to assess etiology or clinical significance, he added: "We see in the future no standalone use of this technique; (however), we see a very important supporting role: aiding the experienced radiologist reader and helping him to increase his efficacy and find a hopefully conclusive and correct diagnosis."
Subtle lesions
Another study looked at CAD's ability to detect subtle, peripheral lung lesions that had been missed when they were originally interpreted. Dr. Fen Li and colleagues from the University of Chicago used 73 such primary lung cancer cases in 106 low-dose CT exams of patients who participated in a three-year lung screening trial in Nagano, Japan.
The group's hybrid CAD scheme, developed at the University of Chicago's Kurt Rossmann Laboratories, was designed to enhance potential cancers and suppress normal background structures, Li said.
In the retrospective observer study, six radiologists reviewed 20 cases from the cohort, 10 of which were normal, or had benign tumors or scarring, and 10 of which contained primary lung tumors, ground-glass, mixed ground-glass, and/or solid opacities.
The radiologists, who were blinded to the mix of cases as well as the diagnoses, read each case on a bank of three LCD monitors, first without, and then with the aid of CAD, indicating their confidence levels and the likeliest location of the tumors.
With CAD, sensitivity for detecting cancer cases was 83%, with a mean 5.8 false positives per case. As for confidence, the average Az value increased from 0.74 to 0.86, which was statistically significant (p=0.02). The sensitivity for detection of tumors increased from 43% pre-CAD to 68% post-CAD, Li said, and CAD improved the performance of every reader, although in some readers the improvement was marginal.
"Lung cancers missed at CT scan were (still) very difficult to detect in an observer study," Li said. "However, our CAD system can improve radiologists' performance in detecting these subtle cancers."
By Eric BarnesAuntMinnie.com staff writer
January 30, 2004
Copyright © 2004 AuntMinnie.com