Computer-aided detection (CAD) has become an important part of image evaluation for the breast, colon, and lung -- and, more recently, for the brain and musculoskeletal and vascular systems as well.
Unfortunately, nearly all CAD systems in clinical use today have a major shortcoming: the need to transfer the image data to a separate workstation to run the CAD software, with CAD data remaining separate from the PACS images radiologists read in their normal workflow.
"The common workflow in clinical practice still includes CAD as a standalone workstation," said Paulo Mazzoncini de Azevedo-Marques, Ph.D. "It's a problem and a limitation to inserting CAD into the clinical environment. Our work has been to try to implement CAD-PACS integration to characterize diffuse lung disease, and also to be able to give CAD results in a more friendly way to the radiologist."
Mazzoncini de Azevedo-Marques is a researcher and lecturer at the imaging sciences center of Ribeirão Preto School of Medicine at the University of São Paulo in Brazil. His co-investigators in the project are Samuel Covas Salomão, Agma Juci Machado Traina, Marcelo Ponciano da Silva, Alessandra Alaniz Macedo, and Hugo Cesar Pessotti.
If the CAD system could be integrated with the PACS network, the thinking went, the PACS server could manage the images all by itself.
Making it work requires sending the high-resolution thoracic CT images to the CAD application for processing, and then returning them, transformed, to the PACS network. The combined results are easily accessible and clinically useful as patient data, Mazzoncini de Azevedo-Marques said in a presentation at the 2009 Computer Assisted Radiology and Surgery (CARS) meeting in Berlin.
The research is supported by the university, as well as by the State of São Paulo Research Foundation (FAPESP) and Brazil's National Council for Scientific and Technological Development (CNPq), Mazzoncini de Azevedo-Marques said.
Built on two systems
The integration process relies chiefly on two components: a communication agent (dcm4che toolkit) for DICOM functionality and an image-processing pipeline in the CAD server.
 |
| The CAD-PACS integration framework relies on two interacting systems: the communication component that performs DICOM functionalities and the image-processing pipeline on the CAD server. All images courtesy of Paulo Mazzoncini de Azevedo-Marques, Ph.D. |
The communication component is a high-performance open-source implementation of the DICOM standard developed in the Java programming language. Its job is to interact periodically with the PACS, performing client functions DICOM C-FIND and DICOM C-MOVE. Queries based on the DICOM header are defined for each specific task.
The dcm4che toolkit's query process uses information about the modality, the anatomic region, and the imaging protocol to retrieve the requested study from the PACS server. When the PACS server receives a new high-resolution CT chest study that was acquired using the diffuse lung disease protocol, CAD also needs a copy, so the images are examined slice by slice in the CAD pipeline, Mazzoncini de Azevedo-Marques explained.
 |
| The DICOM open-source communication component (dm4chee toolkit) interacts with the PACS server, performing client functions DICOM C-FIND and DICOM C-MOVE. Queries directed by the DICOM header are defined for each task. The query process uses information about the modality, the anatomic region, and the imaging protocol to retrieve the requested study from the PACS server. |
"In the CAD server, we have an application that opens the DICOM file, extracts the information and images, applies the imaging processing pipeline, extracts the results, converts the results into a DICOM file again, and sends it back to the PACS server," he said. "When the radiologist is going to look at the images, he or she is able to see the original exam and also the processed images side by side."
Pipeline tool
The CAD pipeline component performs five separate steps: preprocessing, segmentation, feature extraction, classification, and postprocessing, Mazzoncini de Azevedo-Marques said.
The preprocessing step extracts images from the DICOM files. Segmentation divides the images into regions of interest (ROI) of 20 x 20 pixels each. The classification step uses a KNN classifier to categorize each ROI into one of the nine patterns.
Two of the nine classes, background and outside tissue, indicate regions outside the lungs. The remaining seven classes refer to patterns found in the lungs: normal parenchyma, ground-glass opacities, reticular and linear opacities, nodular opacities, honeycombing, emphysematous change, and consolidation.
 |
| Graphic user interface of image-processing pipeline (implemented in Java) that performs five separate steps: preprocessing, segmentation, feature extraction, classification, and postprocessing. |
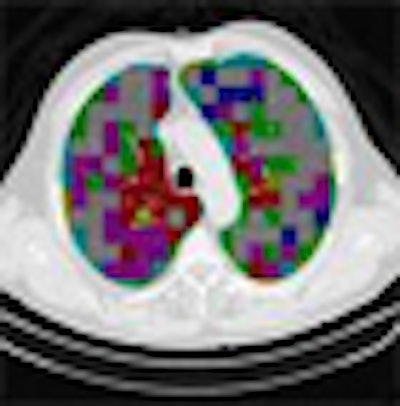
"These are the most common patterns -- this is not a classification of the disease," Mazzoncini de Azevedo-Marques said. "To classify disease is more complicated than this. It's just a classification of the kind of pattern the radiologists are going to find in the space of the lung. We can show this [pattern map] together with the previous exam."
In the last step, postprocessing, each pattern type is assigned a color label and the DICOM file is rebuilt. The communication/archiving agent finishes off the process by including the image slices with the labeled ROIs as a new image series in the exam and sending it back to the PACS server. The color coding allows radiologists to easily see which lung regions might be affected by a particular type of diffuse lung disease.
The CAD pipeline component also uses Java, according to Mazzoncini de Azevedo-Marques. A classification algorithm extracts features from each ROI using values calculated from co-occurrence matrices (energy, contrast, correlation, entropy) obtained for four directions: horizontal, vertical, two diagonal levels, and one level of Daubechies wavelets (for energy and entropy).
Energy, a standard term for classification values, refers to the frequency spectrum in the image, which is calculated by measuring the HU value and then counting its frequency in an image dataset, he said. High-energy data occur more frequently and, as a result, show less variation and a smoother appearance.
A nearest-neighbor ROI scheme was used to associate each region to one of nine pattern classes. Multiple imaging studies selected by a chest radiologist were used for the pattern-recognition algorithm training data, including normal images (20 ROIs), ground-glass opacities (20 ROIs), reticular and linear opacities (15 ROIs), nodular opacities (15 ROIs), honeycombing (20 ROIs), emphysematous change (20 ROIs), and consolidation (15 ROIs).
The researchers trained and tested the system classification algorithm using a 10-fold cross-validation methodology. To validate the framework, they built a test environment using Conquest DICOM software in the PACS server and K-PACS as the DICOM client and interface visualization in the radiology workstation.
Conquest is a full-featured DICOM server developed using the public domain UCDMC DICOM code. K-PACS is a free general-viewing application that provides tools for viewing and manipulating DICOM images, Mazzoncini de Azevedo-Marques said. The software also implements the most important DICOM service classes such as store, query and retrieve, and send and move. The CAD server, PACS server, and radiology workstation are all connected through a local area network.
Accurate but for two conditions
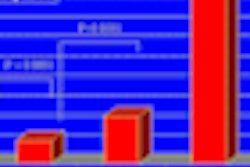
Based on the cross-validation methodology, the classification step delivered an initial average accuracy of 61.6%. However, a confusion matrix analysis showed that the most frequent likely error appeared to be between ground-glass opacities and consolidation, which have similar image profiles.
When the ROIs belonging to these classes were excluded, the average accuracy improved to 78%, Mazzoncini de Azevedo-Marques said.
"If we are to have better results, we have to find a better solution for these kinds of [ground-glass and consolidation] patterns," he said. "But, in general, we can see improvement -- about 78% are put in the right class."
 |
| The classification algorithm training and test was performed using a 10-fold cross-validation methodology, which classified regions of interest in the lung parenchyma into nine patterns commonly seen on thoracic high-resolution CT images. The background and outside tissue classes indicate regions outside the lungs, while the remaining seven classes refer to patterns found in the lungs: normal parenchyma, ground-glass opacities, reticular and linear opacities, nodular opacities, honeycombing, emphysematous change, and consolidation. The classification step delivered an initial average accuracy of 61.6% (above). Eliminating the two most frequently confused categories, ground-glass opacities and consolidation, improved the average classification accuracy to 78%. |
 |
The integrated network needs some refinement, but the first test has already shown that connectivity between the PACS and CAD servers and the workstation is in agreement -- and that it's possible to see the CAD results in a new series in the current exam.
"Our results show that the developed framework has good potential to include CAD results in a friendly way into the radiology workflow," Mazzoncini de Azevedo-Marques said. "Now it's running and we can show the result of image processing for the radiologist inside the exam."
The idea is to expand CAD-PACS integration in multiple CAD applications throughout radiology, Mazzoncini de Azevedo-Marques said.
 |
| The completed CAD-analyzed cases are stored as a new series in the PACS server, where they can be examined side by side. In the color-coding system, normal parenchyma is white; ground-glass regions are blue; reticular-linear, green; micronodules, red; honeycombing, yellow; emphysematous changes, magenta; and consolidation, cyan. |
 |
More desks are needed to evaluate the current integration, along with studies to determine how radiologists are using it and what the system is or isn't doing to help them in clinical practice, Mazzoncini de Azevedo-Marques said.
That's in addition to improving the classification scheme so that it can tell the difference between ground-glass opacities and consolidation. But despite a few challenges, he said, there's no mistaking the need to integrate all of the CAD systems in the radiology department.
"I have worked in this school for a long time, and I am very confident that if we don't try to do this kind of integration in Brazil, CAD is not [going to be] used if CAD is not integrated into PACS, because no one is going to stop what they are doing to look in another place," he said.
By Eric Barnes
AuntMinnie.com staff writer
August 20, 2009
Related Reading
CARS report: New CAD tool follows lung nodules over time, June 30, 2009
CAD offers value in detecting lung nodules with CT, December 17, 2007
CAD may boost radiologists' ability to characterize lung nodules, November 25, 2007
CARS news: USC group develops home-grown CAD-PACS integration toolkit, June 29, 2007
Automated analysis tools vary in pulmonary nodule measurements, June 25, 2007
Copyright © 2009 AuntMinnie.com