An improved computer-aided diagnosis (CAD) scheme has succeeded in detecting colorectal polyps in CT with high accuracy and a low false-positive rate compared to earlier versions.
The system is designed to save time and reduce human error in the detection of adenomatous polyps, helping to pave the way for wider use of virtual colonoscopy for colorectal cancer screening. Its principal developer, Dr. Hiro Yoshida from the University of Chicago, told AuntMinnie.com that a commercial development deal for the system could be announced soon in cooperation with a multimodality imaging vendor.
Writing in Radiographics, Yoshida and colleagues from the University of Chicago found the system to be highly sensitive for the detection of colorectal polyps, with a low rate of false-positive results. Performance has been improved from that of earlier results, due in part to advances in the group's underlying colon segmentation technique (Radiographics, July-August 2002, Vol. 22:4, pp. 963-979).
The system
Even with expert abdominal radiologists on the job, interpreting an entire virtual colonoscopy examination is time consuming. According to the authors, interpretation time for an average study comprising 400-700 axial CT scans ranges anywhere from 10-40 minutes. Moreover, recent studies have shown that interpreting 3-D endoluminal views along with 2-D axial slices produces better results than 2-D interpretation alone, which can also increase the amount of time spent on each study.
But regardless of the method used, "radiologists could miss polyps and report false-positive findings due to perceptual errors caused by normal structures that mimic polyps," they wrote. "Therefore, the diagnostic performance of (virtual colonoscopy) is indeterminate, being susceptible to human error." Virtual colonoscopy also has an arduous learning curve, and a lack of visual clues, such as mucosal color changes, that are helpful in conventional colonoscopy.
The researchers designed the technique in an effort to overcome these persistent challenges. The system begins by generating an isotropic 3-D volume from a virtual colonoscopy CT dataset acquired axially in either the prone or supine position. Next, a knowledge-guided colon segmentation process is applied to eliminate as much extracolonic data as possible.
The computer then applies two 3-D geometric feature tests to the segmented dataset. The first, volumetric shape index, identifies the type of shape represented on the colon wall, such as "cup," "ridge," "saddle" or "cap." The second, volumetric curvedness, represents the degree and dimensions of the curvature seen in a particular shape.
 |
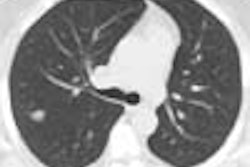
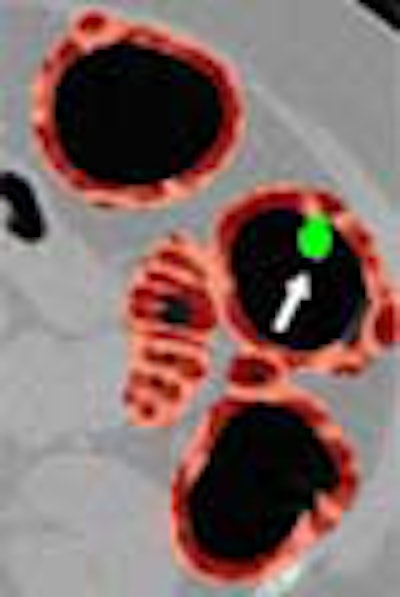
| Left, axial view of a polyp in the descending colon (arrow). Right, display of computer-aided detection (CAD) result for the same polyp. Regions likely to represent polyps, folds, and colonic wall are highlighted in green, pink, and brown, respectively. The polyp (arrow) is correctly highlighted in green by CAD. |
"One of the most important advantages of using the shape index in shape analysis is that the transition from one shape class to another is continuous; thus, the shape index can be used to describe subtle shape variations effectively," the authors wrote, adding that the use of both geometric feature tests exceeds the value of either technique in distinguishing polyps from other structures.
In the volume-rendered endoscopic views, voxels with the shape-index values corresponding to the cap, saddle/ridge, and other classes are colored green, pink, and brown respectively, enabling clear delineation of CAD-detected polyps from other structures.
Hysteresis thresholding is then applied, starting with seed points, to extract large connected components corresponding to the shape of a polyp. This step is needed to compensate for shape variations in the peripheral regions of a polyp. Finally, a fuzzy c-means clustering algorithm is applied to merge multiple detections of the same polyp into one.
 |
| Above, 3-D endoscopic view of the same CAD result. |
The incidence of false positives is reduced by two methods. First, a process known as direct gradient concentration helps separate polyps from other structures by assessing textural properties. Due to the partial-volume effect, the authors explained, gradient vectors representing the soft tissue of true polyps tend to converge at the center of the polyp, forming a spheric concentration pattern, which is identified by the computer.
The last step puts the pieces together. A quadratic discriminant analysis uses statistical classifiers to combine the shape index, directional gradient concentration, CT values, and gradient and variance of CT values to obtain the final detected polyps, which are then displayed on a graphical user interface.
 |
| Snapshot of the Colon CAD Workstation. CAD results are displayed as a thick volume encompassing the colonic wall, using the original green/pink/brown coloring scheme. Images courtesy of Dr. Hiroyuki Yoshida. |
Testing CAD
In the Radiographics study, the group examined CT data in 71 patients (31 men and 40 women, age 32 to 84) who were referred for virtual colonoscopy. Imaging was performed on both 9800 and LightSpeed QX/i CT scanners (GE Medical Systems, Waukesha, WI), following standard bowel prep and insufflation with room air. Virtual colonoscopy was followed by same-day conventional colonoscopy in all patients. Two experienced radiologists evaluated the virtual colonoscopy results, which were compared with the optical colonoscopy results.
In all, 21 colonoscopically proven polyps 5 mm or larger were found in 14 of the 71 patients. Measured primarily by colonoscopy and pathology reports, 15 of the 21 polyps were between 5 mm and 10 mm in diameter in size, while 6 were 10 mm and larger, including 1 polyp measuring 25 mm.
The performance of the CAD scheme was measured both by polyp and by patient, and the average number of false-positive findings calculated as an index of the false-positive rate. By patient, the CAD scheme yielded 100% sensitivity, with an average of two false-positive findings per patient. By polyp, the CAD scheme was 90% sensitive, detecting 19 of 21 polyps with the same false-positive rate.
"Two polyps were missed at the by-polyp analysis," the authors wrote. "One was an 8-mm polyp that was located at a narrow valley where two folds merge," and was also blurred by motion artifact. The other was a 6-mm polyp that appeared to be flat and much smaller than expected, probably due to partial-volume effect.
Among the false-positive results detected by CAD, approximately 40% were caused by folds, 15% by residual materials inside the small bowel and stomach, 10% by ileocecal valves, and 5% by flexural pseudotumors.
The volumetric shape index used in the CAD algorithm assures good detection of most polyps, with the exception of sessile polyps that do not protrude well into the lumen, the group wrote. Likewise, infiltrating carcinoma and diffuse thickening of a fold do not demonstrate a polypoid shape, and may be difficult to detect using the scheme. And while most lobulated villous polyps can be reliably detected, villous polyps with fine lobulation may be missed, they wrote. While working to improve the system, the group is currently studying patients with different types of polyps to assess the significance of these issues.
"Our CAD scheme is expected to reduce interpretation time substantially, while maintaining or improving diagnostic accuracy," they concluded. "Therefore, (it) has the potential of making CT colonography a viable option for screening large patient populations, resulting in earlier detection of polyps and colon cancer and concomitant reduction of mortality from cancer."
Follow-up studies
Since the above study was concluded, group has developed a new feature-guided analysis technique to further reduce false positives, Yoshida wrote in an e-mail to AuntMinnie.com. The data used in the original study were reexamined to evaluate the new technique.
In 14/72 patients with colonoscopy-proven polyps 5-25 mm in diameter, detection sensitivity was 100% by patient, and 95% by polyp, Yoshida wrote.
Compared to a mean of 2.0 false positives per patient in the original study, "the false-positive rate of our CAD scheme with feature-guided analysis was 1.3 false-positive detections per patient (1.5 by polyp)," Yoshida wrote.
In another study of 44 subjects who underwent virtual colonoscopy, the group found multidetector-row CT (MDCT) reduced the false-positive rate even further compared with single-detector CT (SDCT) scanners. Among the cases, 22 were acquired by SDCT, including 13 adenomatous polyps (>5 mm). The remaining 22 cases were acquired by MDCT including 16 colonoscopically confirmed polyps (>5 mm), Yoshida stated.
"By-patient sensitivity was 100% in both sets of cases," he wrote. "However, the average number of false positives per patient was 0.9 for MDCT, (vs.) 1.6 for SDCT. In a by-polyp analysis, the sensitivity and false positives per patient were 95% and 0.9 for MDCT, respectively," vs. 90% and 1.6, respectively, for SDCT.
By Eric BarnesAuntMinnie.com staff writer
November 6, 2002
Virtual colonoscopy: 2-D vs. 3-D primary read, June 3, 2002
New CAD technique improves CT colonography, December 21, 2001
New CAD scheme for lung nodules reduces false positives, July 4, 2000
Copyright © 2002 AuntMinnie.com