Modifying a commonly used scale for stroke prediction in transient ischemic attack (TIA) patients to take into account whether acute ischemia is present on CT increases the scale's accuracy, according to a presentation this month at the Canadian Stroke Congress in Ottawa, Ontario.
Canadian researchers have begun to modify the eight-point Age, Blood Pressure, Clinical Features, Duration of Symptoms, and Diabetes (ABCD2) scale based on their study of 2,028 consecutive emergency room patients at several centers. They have subsequently recruited more patients, and hope to have a completely revamped scale ready for publication or presentation next spring or summer. It will take into account the presence of acute ischemia, as well as chronic ischemia, microangiopathy, and a range of other clinical data.
"Nobody before has looked at putting the imaging together in a clinically useful way to impact the management of potential stroke patients," said lead investigator Dr. Michael Sharma, deputy director of the Canadian Stroke Network and assistant professor of medicine at the University of Ottawa. "We found that adding the CT finding of acute ischemia to the ABCD score increases our discriminatory power modestly, but we need to improve it more. That's why we're continuing to refine it."
The ABCD2 scale uses components such as patient age, blood pressure, and symptom duration to generate a score of up to eight points that predicts a patient's risk of stroke at two-day, seven-day, and 90-day intervals. For example, a patient with a score of six to seven points is considered to be at high risk of stroke.
In previous research, Sharma and colleagues showed that in the same group of patients, the ABCD2 scale has 94.7% sensitivity but only 12.5% specificity for predicting imminent stroke when the standard cut-off of two out of seven points is used. The scale's accuracy is also low when using a cut-off of five points (Canadian Medical Association Journal, July 12, 2011, Vol. 183:10, pp. 1137-1145).
Sharma and several other investigators also showed in earlier research that when clinicians determine which TIA patients are at highest risk of stroke -- using carotid Doppler ultrasound, electrocardiogram, and Holter monitor data -- and admit them for urgent care, this drastically reduces the stroke and mortality rates (Stroke, November 2010, Vol. 41:11, pp. 2601-2605).
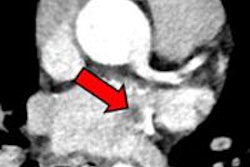
They therefore began to study how to improve the ABCD2. The team first studied whether CT findings of acute ischemia (AI), chronic ischemia (CI), or microangiopathy (MA) within 24 hours of a TIA help predict the occurrence of a stroke soon after TIA. Among the cohort of 2,028 patients, there was a 1.5% stroke rate at two days and a 3.4% stroke rate at 90 days. There were 814 patients with ischemic changes at baseline CT.
The team used logistic regression analysis to examine data from patients who had a stroke within two days of a TIA.
Odds ratio of stroke by type of ischemia as detected on CT
|
|||||||||||||||
| All odds ratios are compared to patients with no ischemic changes at baseline. All p-values < 0.05. |
"What really drove the risk was the finding of acute changes on CT -- by themselves or in any combination," Sharma said.
As a result, they sought to determine whether adding one point to the ABCD2 for the presence of acute ischemia on CT increases its accuracy. The modified scale, which they dubbed the ABCD2Ia, runs from 0 for no risk of stroke to 10 for highest possible risk of stroke.
Based on a cohort that had grown to 2,046 patients, they found that the ABCD2Ia was, indeed, more accurate than the original ABCD2 or another modified version known as ABCD2I for predicting stroke at two, seven, or 90 days. This was shown by higher values as measured by the area under the receiver operator characteristics curve (AUC) at each time point.
AUC values by type of ABCD scale
|
|||||||||||||||||||