When patients are scanned prone and supine for virtual colonoscopy (also known as CT colonography, or CTC), adenomatous polyps don't change much in size or shape. But a new study found that hyperplastic polyps tend to flatten out in VC compared to optical colonoscopy -- especially in prone images where the pressure from colonic insufflation is higher -- to the point where they're harder to detect.
"It's known that the sensitivity of CTC for detecting adenomatous polyps is about 10% to 20% higher than for detecting hyperplastic polyps based on data from a number of studies, including the [Department of Defense (DOD)] trial and ... the ACRIN [6664 National CT Colonography] trial," said Dr. Ronald Summers, Ph.D., of the National Institutes of Health (NIH) in Bethesda, MD.
And it makes sense that adenomatous polyps -- the kind more likely to harbor advanced histology -- wouldn't deform in the face of higher air or CO2 pressure.
"Adenomatous polyps are much more cellular, and you can see how they might be firmer mechanically than hyperplastic polyps, which are less cellular," Summers said in a presentation at the 2008 RNSA meeting in Chicago. "The purpose of the study was to determine objectively whether hyperplastic colonic polyps at CTC were indeed flatter than adenomatous polyps [based on] measurements that were normalized by the width or size of polyp."
The subjects were participants in the Department of Defense study comprising 1,186 CTC datasets from three centers, all evaluated with segmental unblinding and same-day conventional colonoscopy (New England Journal of Medicine, December 4, 2003, Vol. 349:23, pp. 2191-2200).
Room air insufflation was self-administered to tolerance, and prone and supine images were acquired in each subject. There were 185 subjects with at least one adenoma 6-10 mm in size. Summers and colleagues evaluated 176 adenomas and 83 hyperplastic polyps, with sizes evaluated by calibrated guidewire.
Polyps were grouped by size, and in each group, the heights of the hyperplastic polyps were compared to the heights of the adenomatous polyps using a two-tailed, unpaired, unequal variance t-test. Because optical colonoscopy size measurements could incorporate height as well as width, the analysis was repeated using a validated automated measurement of polyp width. Automated width measurements could fall outside the range of 6-9 mm.
The automated polyp measurement scheme (Yao J et al, in press) utilizes a "pattern-recognition topographic height method similar to what you might see in a geographic terrain map where you have different curves showing different lengths of structures on the terrain," Summers said. When the technique is applied to colonic mucosa, curves depict the polyp contours as curves and the area around the base as dots, he noted.
Polyp height was measured as the distance between the peak and the base of the polyp. Width was calculated as the maximum difference of points on the base. Measurements on the investigational software application (Viatronix, Stony Brook, NY) were compared with calibrated guidewire measurements at optical colonoscopy.
In all, 131 of 133 adenomatous polyps (98.4%) and 57 of 59 hyperplastic polyps (96.6%) were measurable using the automated software.
"The [percentages] of polyps in the adenoma and hyperplastic categories that were measurable were not significantly different. This was important because I was concerned about having biased datasets under-reporting one group or another," Summers said.
Shrinking hyperplastic polyps
The results showed that 6- to 10-mm hyperplastic polyps were up to 27% flatter than adenomatous polyps, with height-to-width ratios approximately 15% lower.
For groupings based on measured size at optical colonoscopy, the heights of the adenomatous and hyperplastic polyps are shown below (p > 0.09).
|
|||||||||||||||||
The results were similar if polyps were grouped using the automated width measurements (p = 0.04 for polyps 10 mm or larger; p > 0.10 for all other polyps).
|
|||||||||||||||||||||||
"When the polyps were considered as a whole, there was a statistically significant difference in the height-to-width ratios between adenomas and hyperplastic polyps," Summers said. Compared to optical colonoscopy, "there was about a 15% difference in height-to-width ratios between the two histologic types."
"We also looked at heights and height-to-width ratios for polyps of different shapes as determined by colonoscopy and VC, and of interest flat and sessile polyps were both under 3 mm, and the height-to-width ratios were under 0.5 mm for both flat and sessile polyps," he said.
This finding calls into question the definition of a flat polyp, which applies whenever polyp height is less than half of the polyp width, according to Summers.
"We think a more appropriate definition of a 6- to 10-mm flat polyp is one with a height less than or equal to 2 mm or a height-to-width ratio less than one-third," he said.
Finally, an analysis of polyp ratios found at prospective interpretation and those not found prospectively showed that height and height-to-width ratios were similar for adenomas, but there was an almost-significant difference in height of adenomas detected and not detected, he said.
 |
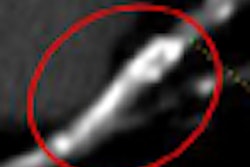
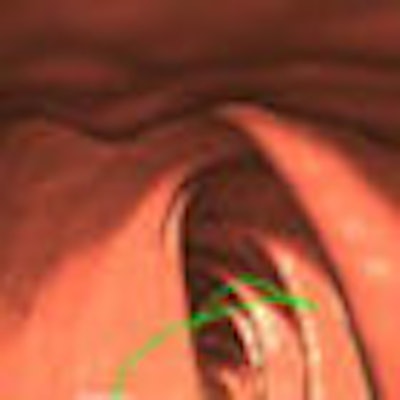
| Above, an adenoma measuring 8 mm at optical colonoscopy (per calibrated guidewire) measured 1.9 mm and 1.8 mm high and 7.7 mm and 7.0 mm wide in supine (top) and prone (bottom) CTC (per automated measurement algorithm), respectively. Below, a hyperplastic polyp measuring 8 mm at optical colonoscopy measured 2.46 mm and 1.65 mm high and 9.89 mm and 10.32 mm wide in supine (top) and prone (bottom) CTC images, respectively. The automated polyp measurement scheme utilizes a pattern-recognition topographic height method similar to that of a terrain map. Polyp contours are depicted as curves. All images courtesy of Dr. Ronald Summers, Ph.D. |
 |
Six- to 10-mm hyperplastic polyps were up to 27% flatter than adenomatous polyps, with height-to-width ratios approximately 15% less than adenomatous polyps, Summers concluded. And false-negative hyperplastic polyps were flatter than false-negative adenomatous polyps.
"The implication of this finding is that hyperplastic polyps may be harder to detect at CTC because they're more pliable and tend to flatten when the colon is distended," he said. "And this is potentially beneficial because hyperplasic polyps have little or no malignant potential and detecting such polyps could lead to unnecessary polypectomy."
By Eric Barnes
AuntMinnie.com staff writer
March 11, 2009
Related Reading
Automated polyp measurement cuts variability, May 21, 2008
Accuracy of polyp measurements depends on CT values, February 21, 2008
Colon polyps accurately measured using automated and manual 3D techniques, January 5, 2007
Reading method, insufflation affect polyp measurements, November 4, 2005
Polyp measurements more accurate in 3D, September 6, 2005
Copyright © 2009 AuntMinnie.com