A new computer-aided detection (CAD) algorithm detected more lung nodules with fewer false positives than conventional schemes, potentially delivering a better and more cost-effective way to screen for lung cancer with CT, say researchers from Catholic University of America and Georgetown University Medical Center in Washington, DC.
The researchers used discrete wavelet transform (DWT) analysis -- until now a method more commonly used in preparation for data compression -- to analyze CT image data for differences between benign and malignant lung nodules.
Dr. Matthew Freedman, a radiologist and associate professor of oncology at the institutions, got involved with lung cancer research in the 1970s, when the still-unanswered question of whether screening could save lives was first addressed with chest radiography and then CT. New information is on the way, pending completion of the National Lung Screening Trial (NLST) and other large trials, Freedman said in his presentation of the study at the 2008 Computer Assisted Radiology and Surgery (CARS) meeting in Barcelona, Spain.
Although definitive answers have been hard to come by with regard to lung screening, the research environment is definitely improving, Freedman said. Most important, image data are finally becoming publicly available for the evaluation of promising new technologies such as computer-aided detection of lung nodules.
In CAD research, the group is testing several new methods including wavelet transform analysis. First-generation CAD systems have been shown to detect many more nodules than radiologists alone, he said. The next step is to refine their capabilities.
"There is clear improvement with CAD: the p-value is highly statistically significant, and radiologists can improve their detection of primary lung cancers," Freedman said of earlier results with the group's previously developed CAD scheme for chest radiography (OnGuard, Riverain Medical, Miamisburg, OH). "But improving sensitivity alone is not sufficient, because with CAD you get increased numbers of false positives," he said. As a result, current research efforts are focused on decreasing false positives, or "improving the specificity of our computer approaches to detecting malignant lung cancers," Freedman said.
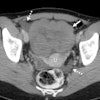
A basic problem with CT screening for lung cancer is that many patients present with multiple nodules at CT, few of which are malignant, Freedman said. As a result, screening recommendations are nonintensive, with scans repeated at three, six, or 12 months for suspicious findings, again based on the assumption that most small nodules are benign.
Unfortunately, this practice "increases patient anxiety," and if the nodule is malignant, it potentially allows the nodule to grow and spread, he said. The researchers were looking for better ways to distinguish benign from malignant when they decided to look at DWT analysis.
"The goal of this project is to see if measurements using discrete wavelet transform could finally classify CT-detected lung nodules into benign and malignant categories, or long-term to help guide the intensity of clinical follow-up with CT, and eventually combine the image analysis with [the group's] epidemiology analysis," Freedman said. The study was led by Teresa Osicka, Ph.D., along with Freedman and Farid Ahmed, Ph.D.
Discrete wavelet transform analysis, while rarely applied to CAD schemes, has many applications in science, engineering, mathematics, and computer science. It is most commonly used for signal coding as a precursor to data compression.
"Wavelets were chosen, first of all, because as far as we know it had not been done before," Freedman said. "Second, wavelets have been used for the analysis of nonmedical images" and a few breast images as well, he said. "Wavelets, as you may know, decompose the image into several levels and several different aspects, and to each of these there are values attached" based on image features such as energy, minimum, maximum, range, mean, median, variance, and standard deviation.
While conventional CAD feature extractors rely on the assumption that the texture can be defined by the local statistical properties of pixels, or gray levels, the limitation is that images are analyzed at a single scale. On the other hand, wavelets are capable of analyzing a multiscale representation of the image data, Freedman explained.
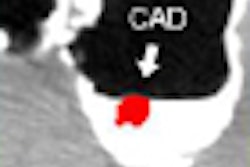
 |
| Unlike conventional feature extractors used in CAD algorithms, DWT provides a multilevel depiction of pixel grayscale data. All images courtesy of Dr. Matthew Freedman. |
The analysis was performed on CT data from the NLST that is available to researchers. The training data for the algorithm consisted of 90 nodules (48 benign and 42 malignant) and the separate test data included 48 nodules (24 benign and 24 malignant). Benignity or malignancy was based on clinical data when available or "ground truth" consensus of expert readers. The average size of test data nodules was 9.5 mm (benign 7.8 mm, malignant 11.3 mm), and the average size for the training data was 9.9 mm (benign 7.8 mm, malignant 12.3 mm).
"The malignant nodules were slightly bigger, but we had a large amount of [size] overlap to begin with," he said. The analyses of various methods were performed on a single central slice in each region of interest.
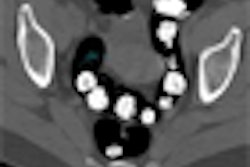
Most CT images were acquired on a Somatom Volume Zoom scanner (Siemens Healthcare, Malvern, PA) using 2-mm slice thickness, 40-60 mAs, and 120-140 kVp. Data extracted by the radiologist were analyzed in the region of interest in three squared window frames (16 x 16 pixels, 32 x 32 pixels, and 64 x 64 pixels) that included the unsegmented nodule and the area around it.
The features used to characterize the nodules were collected from coefficients created by five families of wavelets -- Haar (n = 1 wavelet), Daubechies (n = 9), Symmlets (n = 7), Coiflets (n = 5), and Biorthogonal (n = 30) -- including 15 for decomposition and 15 for synthesis, resulting in the analysis of 52 wavelets in all.
"Using a brute-force approach, we looked at many different possible features of more classical methods ... to see which of these would be able to distinguish these groups of nodules," he said. Classical CAD methods included feature generation schemes, the use of feature parameters based on image histograms, run-length matrix, image gradient, and finally, spatial gray-level co-occurrence matrix (SGLCM), which would ultimately provide the closest competition to wavelet transform analysis.
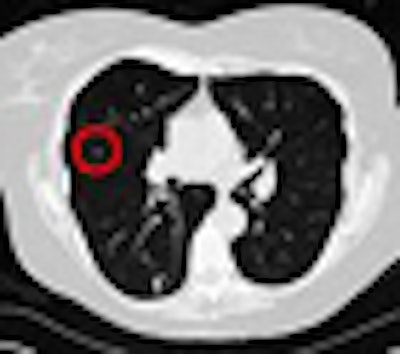
 |
| Lung nodule classification begins with extraction of identified nodules in three different window sizes. Wavelet transform and conventional techniques are then used to generate sets of attributes for characterization. Features are selected and classified, and they are validated using a "leave-one-out" cross-validation method. Finally, the classification performance is evaluated. |
According to the results, symmetric biorthogonal wavelets provided the best benign/malignant classification accuracies, with 95.8% correct classification in the 16 x 16-pixel window and 93.8% correct classification in both the 32 x 32-pixel and 64 x 64-pixel windows. Among traditional CAD classification methods, SGLCM yielded the highest classification accuracy, with 79.2% accuracy in the 16 x 16-pixel window, 93.8% in the 32 x 32-pixel window (where it outperformed the wavelet method), and 83.3% in the 64 x 64-pixel window.
 |
 |
 |
| Results for regions of interest demonstrate the overall superiority of DWT (black) compared to SGLCM (green) in the 16 x 16-pixel window (top) (p-value of the difference = 0.0433), 32 x 32-pixel window (middle) (no significant difference), and 64 x 64-pixel window (bottom) (p-value of the difference = 0.0412) for nodule classification by accuracy (left), specificity (middle), and sensitivity (right). |
The DWT method proved to be crucial in the characterization of nodules, he said, adding that the method's accuracy in classifying unsegmented nodules in the largest windows was particularly encouraging.
"It indicates that even if you're not very good at showing where the nodule is, the system still gives you relatively good results," Freedman said. "What we've shown is that in this preliminary study based on a limited dataset ... wavelet analysis using linear discrete analysis can classify nodules into benign and malignant with relatively good efficiency." On the other hand, conventional CAD analysis methods are more sensitive to the size of the window, thus the nodule signal itself.
 |
| The researchers' previously demonstrated color-coded dissimilarity matrix depicts the similarity or dissimilarity of nodule samples, i.e., how similar or dissimilar benign (top row) and malignant nodules (bottom row) are compared to each other using DWT (left) and SGLCM (right). Blue indicates similar and red dissimilar, demonstrating that overall agreement is better using the wavelet transform method compared to SGLCM. |
"Segmentation of nodules, which is always problematic and quite time-consuming when done by humans and [inaccurate] when done by computer, may not be necessary," he said. Segmenting nodules within squared windows avoids the uncertainties of boundary segmentation without decreasing previously reported classification accuracies, Freedman said, noting that the researchers have not tested the wavelet method on segmented nodules.
By Eric Barnes
AuntMinnie.com staff writer
August 4, 2008
Related Reading
CAD offers potential for diagnosing pediatric pneumonia, July 23, 2008
CAD helps residents identify lung nodules on DR, May 20, 2008
Criteria determine CAD mark sensitivity, March 20, 2008
CAD provides mixed benefits for DR lung exams, March 8, 2008
DR image processing produces mixed CAD results, February 12, 2008
Copyright © 2008 AuntMinnie.com