VIENNA - A new postprocessing technique reveals early cerebral infarction by finding the subtlest areas of hypodensity on plain head CT. Such regions -- separated by a handful of Hounsfield units from the surrounding unaffected tissues -- are rarely visible to the naked eye.
Since unenhanced head CT is usually the first imaging test a patient undergoes after presenting with stroke symptoms, the ability to glean additional information from such data could shave precious hours and minutes off treatment planning, and potentially improve patient outcomes.
The technique is also quick, easy, and inexpensive to perform on commercially available software, according to Dr. Hans Jürgen Huppertz, a neurologist from the University of Freiburg in Germany who described it during Saturday's stroke imaging sessions of the 2005 European Congress of Radiology (ECR).
The earliest signs of infarction are quite subtle on CT, where they often manifest as slight hypodense areas in the cortices or the basal ganglia, he said.
"One problem is that the human eye can only resolve density differences of about 4 HU (or greater), and the first signs can be out of that range," he said. "The other problem is that there is a large variability in expertise in reading these images."
In their study, Huppertz, Dr. C. Grimm, Dr. H. Hochmuth, and colleagues tested the new image-processing algorithm on 12 patients presenting one to six hours after the onset of stroke symptoms. The goal was to determine if the technique could reveal areas of infarct that would normally remain invisible to standard CT for hours or days.
Immediately after presentation in the emergency room with stroke symptoms, the patients underwent cranial CT with a 512 x 512 matrix and 5-mm axial slices through the intra- and supratentorial space. The images were then interpolated to a volume dataset and normalized to a customized CT template using algorithms of SPM2 (Statistical Parametric Mapping Software, Wellcome Department of Imaging Neuroscience, Institute of Neurology, London).
The team divided the process into six steps:
Band-pass filtering between 0-60 HU "to get rid of uninteresting structures like the strata," Huppert said.
Normalization of the image data to a custom-made template, and simultaneous integration of the data volume to 1-mm voxels.
Segmentation of the image data into gray-matter and white-matter compartments, and simultaneous intensity correction.
The data are converted into a binary image with all the voxels set to one. This is accomplished by assigning a value of one to all voxels that include "gray values between the mean gray value of the gray-matter compartment and the mean gray value of the white-matter compartment," he said; all other voxels are set to zero.
The resulting binary image is smoothed by the application of a convolution filter.
Finally, comparison with the normal database is done by calculating the difference between the CT values in each voxel and those of the database of normal scans (30 subjects). The resulting feature map shows subtle loss of density compared to a normal database.
 |
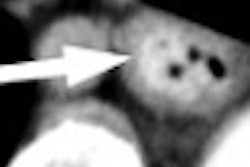
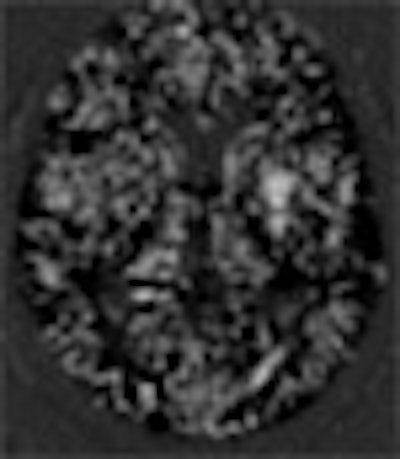
| Clockwise from upper left: 1) CT scan on admission, one hour after onset of dysarthria and hemiparesis. 2) New feature map derived from postprocessing of the original CT scan. 3) Follow-up CT scan the next day shows a hypodense area in the left lenticular nucleus. 4) For comparison, a diffusion-weighted MR image acquired on the day of admission. All images courtesy of Dr. Hans Jürgen Huppertz. |
In all 12 patients, the resulting feature maps showed the areas of infarct much more clearly than in the original CT scans, he said, even eliminating what would have been a false-positive call by the radiologist in one case.
"These preliminary results indicate that this new postprocessing technique may facilitate the interpretation of CT scans in acute cerebral infarction," Huppertz said. "There are several advantages in my opinion: The technique is based on freely available software, it's easy to implement, it takes only five to 10 minutes ... (and) it relies on (CT) data that is already available. Of course it needs further study."
For its next study the group will test radiologists' ability to find infarcted areas in a blinded reading of plain CT images with and without the aid of the feature maps, Huppertz said.
The technique could certainly be used with other imaging modalities, since it is a spin-off of a technique developed for a neuroradiology application in MRI, he said in response to an audience question.
By Eric Barnes
AuntMinnie.com staff writer
March 5, 2005
Related Reading
MR vs. CT? Stroke imaging hinges on more than modality, August 25, 2004
Perfusion CT predicts, measures, thrombolysis benefit after acute stroke, December 24, 2003
Perfusion CT offers speedy access, but MRI gives the "big" picture, February 19, 2003
Copyright © 2005 AuntMinnie.com